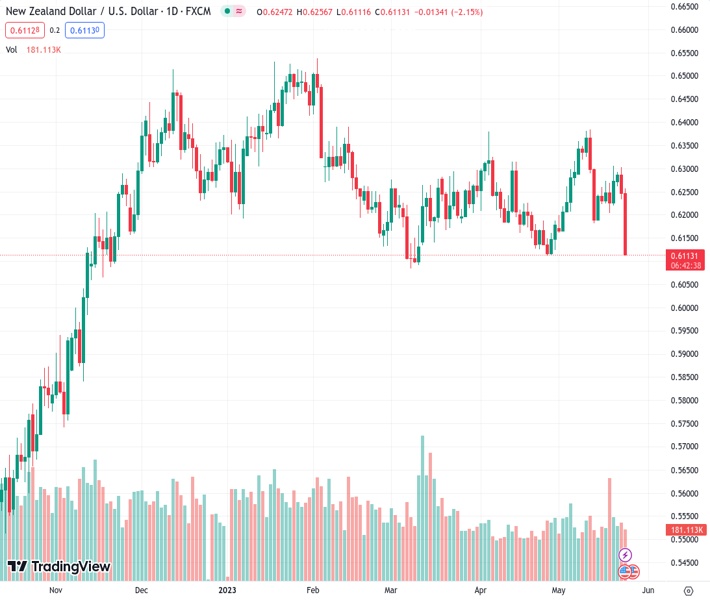
#NZDUSD @ 0.61133 extends the RBNZ-inspired slump and drops to a nearly one-month low. (Pivot Orderbook analysis)
…
This is a premium post.
[s2If !current_user_can(access_s2member_level4)]Please register for FREE REGISTER to read full post below containing analysis. In case of any error or you think you are not able to read the full post below, please email us at support#nehcap.com [lwa][/s2If] [s2If current_user_can(access_s2member_level1)]
- NZD/USD extends the RBNZ-inspired slump and drops to a nearly one-month low.
- A combination of factors continues to underpin the USD and contributes to the fall.
- Investors now look to the FOMC meeting minutes for a fresh directional impetus.
The pair currently trades last at 0.61133.
The previous day high was 0.6303 while the previous day low was 0.6233. The daily 38.2% Fib levels comes at 0.626, expected to provide resistance. Similarly, the daily 61.8% fib level is at 0.6277, expected to provide resistance.
The NZD/USD pair adds to its heavy intraday losses and tumbles to a nearly one-month low during the early North American session on Wednesday, with bears now awaiting a break below the 0.6100 mark before placing fresh bets.
The New Zealand Dollar (NZD) comes under intense selling pressure in reaction to the Reserve Bank of New Zealand’s (RBNZ) dovish shift, signalling that it was done with its most aggressive hiking cycle since 1999. Furthermore, the RBNZ forecasts the official cash rate to peak at its current level, which, along with a generally weaker risk tone, weighs heavily on the risk-sensitive Kiwi and drags the NZD/USD pair lower for the second straight day.
The market sentiment remains fragile amid worries about slowing global economic growth, particularly in China. In fact, data from China last week indicated that the world’s second-largest economy underperformed in April. Apart from this, the US debt ceiling woes temper investors’ appetite for riskier assets. The anti-risk flow is evident from a fresh leg down in the equity markets, which, in turn, benefits the safe-haven US Dollar (USD).
Adding to this, firming expectations that the Federal Reserve (Fed) will keep interest rates higher for longer push the USD Index (DXY), which tracks the Greenback against a basket of currencies, to a two-month high and contributes to the heavily offered tone surrounding the NZD/USD pair. The current market pricing indicates a small chance of another 25 bps lift-off in June and the bets were lifted by the recent hawkish comments by a slew of Fed officials.
Hence, the market focus will remain glued to the release of the FOMC meeting minutes, due later during the US session. Investors will look for cues about the Fed’s future rate-hike path, which will play a key role in influencing the near-term USD price dynamics and provide some meaningful impetus to the NZD/USD pair. Nevertheless, a surprise dovish shift by the RBNZ suggests that the path of least resistance for spot prices is to the downside.
Technical Levels: Supports and Resistances
NZDUSD currently trading at 0.6122 at the time of writing. Pair opened at 0.6248 and is trading with a change of -2.02 % .
| Overview | Overview.1 | |
|---|---|---|
| 0 | Today last price | 0.6122 |
| 1 | Today Daily Change | -0.0126 |
| 2 | Today Daily Change % | -2.0200 |
| 3 | Today daily open | 0.6248 |
The pair remains strongly bearish on the daily time frame. It trades below the 20 SMA @ 0.6237, 50 SMA 0.623, 100 SMA @ 0.6273 and 200 SMA @ 0.6156.
| Trends | Trends.1 | |
|---|---|---|
| 0 | Daily SMA20 | 0.6237 |
| 1 | Daily SMA50 | 0.6230 |
| 2 | Daily SMA100 | 0.6273 |
| 3 | Daily SMA200 | 0.6156 |
The previous day high was 0.6303 while the previous day low was 0.6233. The daily 38.2% Fib levels comes at 0.626, expected to provide resistance. Similarly, the daily 61.8% fib level is at 0.6277, expected to provide resistance.
Note the levels of interest below:
- Pivot support is noted at 0.622, 0.6191, 0.6149
- Pivot resistance is noted at 0.629, 0.6332, 0.636
| Levels | Levels.1 |
|---|---|
| Previous Daily High | 0.6303 |
| Previous Daily Low | 0.6233 |
| Previous Weekly High | 0.6306 |
| Previous Weekly Low | 0.6117 |
| Previous Monthly High | 0.6389 |
| Previous Monthly Low | 0.6111 |
| Daily Fibonacci 38.2% | 0.6260 |
| Daily Fibonacci 61.8% | 0.6277 |
| Daily Pivot Point S1 | 0.6220 |
| Daily Pivot Point S2 | 0.6191 |
| Daily Pivot Point S3 | 0.6149 |
| Daily Pivot Point R1 | 0.6290 |
| Daily Pivot Point R2 | 0.6332 |
| Daily Pivot Point R3 | 0.6360 |
[/s2If]
Nehcap Expert Advisor
The NEHCAP MT4 EA is high quality professional trading system geared to generate returns without using GRID or martingales. Each trade has strict risk per trade parameter. The pairs under management include EURUSD, GBPUSD, AUDCAD, AUDNZD,GBPAUD, EURAUD, EURCAD, CHFJPY and many more.
The system is trading live: LIVE ACCOUNT TRACKING
You can run it free. Apply for a free trial and track our account. Buy the system or use profit share mechanism to generate returns on your MT4.
Join Our Telegram Group


