#USDCAD @ 1.35546 climbs to over a one-week high amid the emergence of fresh USD buying. (Pivot Orderbook analysis)
…
This is a premium post.
[s2If !current_user_can(access_s2member_level4)]Please register for FREE REGISTER to read full post below containing analysis. In case of any error or you think you are not able to read the full post below, please email us at support#nehcap.com [lwa][/s2If] [s2If current_user_can(access_s2member_level1)]
- USD/CAD climbs to over a one-week high amid the emergence of fresh USD buying.
- Hawkish Fed expectations and a softer risk tone continue to benefit the Greenback.
- Bullish Oil prices underpin the Loonie and cap gains ahead of the FOMC minutes.
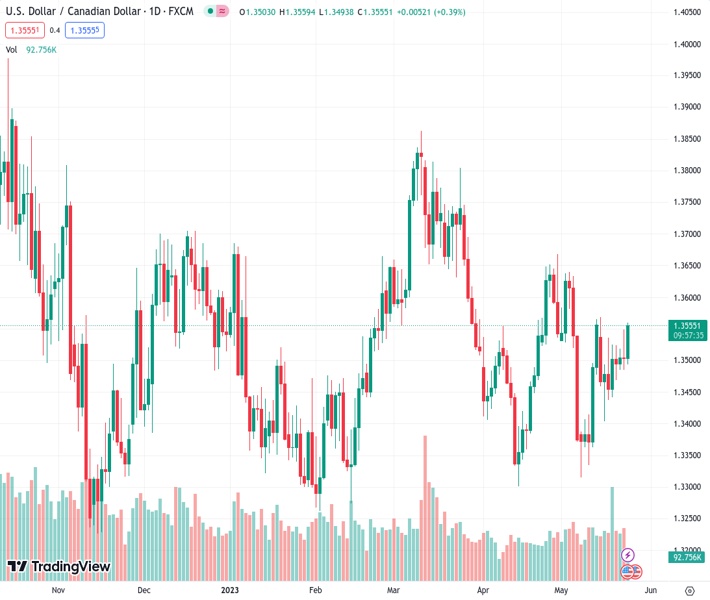
The pair currently trades last at 1.35546.
The previous day high was 1.3549 while the previous day low was 1.3485. The daily 38.2% Fib levels comes at 1.3509, expected to provide support. Similarly, the daily 61.8% fib level is at 1.3524, expected to provide support.
The USD/CAD pair attracts fresh buying on Wednesday and climbs to a one-and-half-week high, around mid-1.3500s during the first half of the European session.
A combination of supporting factors pushes the US Dollar (USD) to a fresh two-month high, which, in turn, acts as a tailwind for the USD/CAD pair. The recent hawkish remarks by a slew of influential Federal Reserve (Fed) officials reaffirmed market expectations that the US central bank will keep interest rates higher for longer. In fact, the markets have started pricing in the possibility of another 25 bps lift-off in June. This, along with a generally weaker risk tone, further benefits the Greenback’s relative safe-haven status.
The market sentiment remains fragile amid worrying signs of slowing global economic growth, particularly in China, and US debt ceiling woes. In fact, data from China last week indicated that the world’s second-largest economy underperformed in April. Furthermore, representatives of President Joe Biden and congressional Republicans ended another round of debt ceiling talks without an agreement to raise the government’s borrowing limit. This tempers investors’ appetite for riskier assets and drives some haven flows.
It, however, remains to be seen if bulls can capitalize on the move amid a further rise in Crude Oil prices, which tends to benefit the commodity-linked Loonie. In fact, US West Texas Intermediate (WTI) Crude rallied nearly 2% intraday, to over a three-week high after Saudi Arabia’s energy minister warned that short sellers should watch out for pain, fueling speculations for further OPEC+ output cuts. This, in turn, warrants some caution before placing fresh bullish bets around the USD/CAD pair and positioning for further gains.
Market participants might also prefer to wait on the sidelines ahead of the release of the FOMC meeting minutes, due later during the US session. The minutes will be closely scrutinized for clues about the Fed’s future rate-hike path, which, in turn, will influence the USD demand in the near term and help investors to determine the next leg of a directional move for the USD/CAD pair. Apart from this, Oil price dynamics might further contribute to producing short-term trading opportunities around the major.
Technical Levels: Supports and Resistances
USDCAD currently trading at 1.3553 at the time of writing. Pair opened at 1.3504 and is trading with a change of 0.36 % .
| Overview | Overview.1 | |
|---|---|---|
| 0 | Today last price | 1.3553 |
| 1 | Today Daily Change | 0.0049 |
| 2 | Today Daily Change % | 0.3600 |
| 3 | Today daily open | 1.3504 |
The pair remains strongly bullish on the daily timeframe. It trades above its 20 SMA @ 1.3504, 50 SMA 1.3532, 100 SMA @ 1.3508 and 200 SMA @ 1.3484.
| Trends | Trends.1 | |
|---|---|---|
| 0 | Daily SMA20 | 1.3504 |
| 1 | Daily SMA50 | 1.3532 |
| 2 | Daily SMA100 | 1.3508 |
| 3 | Daily SMA200 | 1.3484 |
The previous day high was 1.3549 while the previous day low was 1.3485. The daily 38.2% Fib levels comes at 1.3509, expected to provide support. Similarly, the daily 61.8% fib level is at 1.3524, expected to provide support.
Note the levels of interest below:
- Pivot support is noted at 1.3476, 1.3448, 1.3412
- Pivot resistance is noted at 1.354, 1.3576, 1.3604
| Levels | Levels.1 |
|---|---|
| Previous Daily High | 1.3549 |
| Previous Daily Low | 1.3485 |
| Previous Weekly High | 1.3568 |
| Previous Weekly Low | 1.3404 |
| Previous Monthly High | 1.3668 |
| Previous Monthly Low | 1.3301 |
| Daily Fibonacci 38.2% | 1.3509 |
| Daily Fibonacci 61.8% | 1.3524 |
| Daily Pivot Point S1 | 1.3476 |
| Daily Pivot Point S2 | 1.3448 |
| Daily Pivot Point S3 | 1.3412 |
| Daily Pivot Point R1 | 1.3540 |
| Daily Pivot Point R2 | 1.3576 |
| Daily Pivot Point R3 | 1.3604 |
[/s2If]
Nehcap Expert Advisor
The NEHCAP MT4 EA is high quality professional trading system geared to generate returns without using GRID or martingales. Each trade has strict risk per trade parameter. The pairs under management include EURUSD, GBPUSD, AUDCAD, AUDNZD,GBPAUD, EURAUD, EURCAD, CHFJPY and many more.
The system is trading live: LIVE ACCOUNT TRACKING
You can run it free. Apply for a free trial and track our account. Buy the system or use profit share mechanism to generate returns on your MT4.
Join Our Telegram Group


