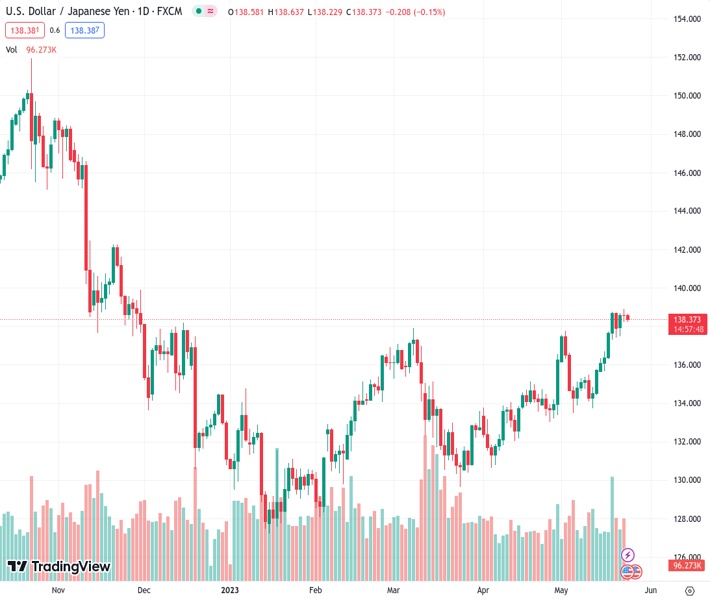
#USDJPY @ 138.287 portrays bearish chart formation at the highest levels in six months., @nehcap view: Pullback expected (Pivot Orderbook analysis)
…
This is a premium post.
[s2If !current_user_can(access_s2member_level4)]Please register for FREE REGISTER to read full post below containing analysis. In case of any error or you think you are not able to read the full post below, please email us at support#nehcap.com [lwa][/s2If] [s2If current_user_can(access_s2member_level1)]
- USD/JPY portrays bearish chart formation at the highest levels in six months.
- Downbeat MACD signals also lure Yen pair bears, 100-HMA, 200-HMA act as extra checks for sellers.
- Bulls need validation from 139.40 to retake control.
The pair currently trades last at 138.287.
The previous day high was 138.91 while the previous day low was 138.24. The daily 38.2% Fib levels comes at 138.5, expected to provide resistance. Similarly, the daily 61.8% fib level is at 138.66, expected to provide resistance.
USD/JPY grinds lower past 139.00, mildly offered near 138.40 heading into Wednesday’s European session.
The Yen pair rose to a fresh high since November 2022 before posting an unimpressive closing the previous day. In doing so, the major currency pair portrays a one-week-old rising wedge bearish chart formation.
Not only the bearish pattern but the downbeat MACD signals and failure to remain firmer at the multi-day high also lures the USD/JPY sellers.
However, the 100-Hour Moving Average (HMA) level of around 138.30 restricts the immediate downside of the Yen pair, a break of which highlights the stated wedge’s confirmation point, namely the lower line surrounding 138.00.
Following that, a quick fall towards the 200-HMA surrounding 137.20 can’t be ruled out. It should be noted, however, that the rising wedge confirmation hints at the 136.00 round figure as a theoretical target.
Alternatively, the stated wedge’s top line, close to the 139.00 round figure by the press time, restricts immediate USD/JPY recovery. Also likely to challenge the Yen pair buyers is the July 2022 high of near 139.40.
Even if the Yen pair manage to cross the 139.40 hurdle, the 140.00 round figure may prod the buyers.
Overall, USD/JPY bulls appear to run out of steam but the sellers wait for clear signals.
Trend: Pullback expected
Technical Levels: Supports and Resistances
USDJPY currently trading at 138.43 at the time of writing. Pair opened at 138.58 and is trading with a change of -0.11% % .
| Overview | Overview.1 | |
|---|---|---|
| 0 | Today last price | 138.43 |
| 1 | Today Daily Change | -0.15 |
| 2 | Today Daily Change % | -0.11% |
| 3 | Today daily open | 138.58 |
The pair remains strongly bullish on the daily timeframe. It trades above its 20 SMA @ 136.03, 50 SMA 134.06, 100 SMA @ 133.29 and 200 SMA @ 137.17.
| Trends | Trends.1 | |
|---|---|---|
| 0 | Daily SMA20 | 136.03 |
| 1 | Daily SMA50 | 134.06 |
| 2 | Daily SMA100 | 133.29 |
| 3 | Daily SMA200 | 137.17 |
The previous day high was 138.91 while the previous day low was 138.24. The daily 38.2% Fib levels comes at 138.5, expected to provide resistance. Similarly, the daily 61.8% fib level is at 138.66, expected to provide resistance.
Note the levels of interest below:
- Pivot support is noted at 138.25, 137.91, 137.58
- Pivot resistance is noted at 138.91, 139.25, 139.58
| Levels | Levels.1 |
|---|---|
| Previous Daily High | 138.91 |
| Previous Daily Low | 138.24 |
| Previous Weekly High | 138.75 |
| Previous Weekly Low | 135.65 |
| Previous Monthly High | 136.56 |
| Previous Monthly Low | 130.63 |
| Daily Fibonacci 38.2% | 138.50 |
| Daily Fibonacci 61.8% | 138.66 |
| Daily Pivot Point S1 | 138.25 |
| Daily Pivot Point S2 | 137.91 |
| Daily Pivot Point S3 | 137.58 |
| Daily Pivot Point R1 | 138.91 |
| Daily Pivot Point R2 | 139.25 |
| Daily Pivot Point R3 | 139.58 |
[/s2If]
Nehcap Expert Advisor
The NEHCAP MT4 EA is high quality professional trading system geared to generate returns without using GRID or martingales. Each trade has strict risk per trade parameter. The pairs under management include EURUSD, GBPUSD, AUDCAD, AUDNZD,GBPAUD, EURAUD, EURCAD, CHFJPY and many more.
The system is trading live: LIVE ACCOUNT TRACKING
You can run it free. Apply for a free trial and track our account. Buy the system or use profit share mechanism to generate returns on your MT4.
Join Our Telegram Group


