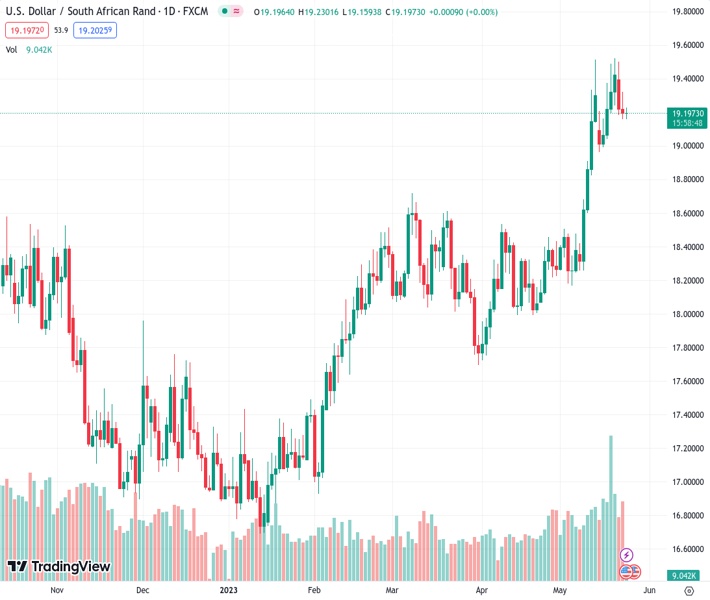
#USDZAR @ 19.1992 is looking to extend its downside built after printing an all-time high of 19.52. (Pivot Orderbook analysis)
…
This is a premium post.
[s2If !current_user_can(access_s2member_level4)]Please register for FREE REGISTER to read full post below containing analysis. In case of any error or you think you are not able to read the full post below, please email us at support#nehcap.com [lwa][/s2If] [s2If current_user_can(access_s2member_level1)]
- USD/ZAR is looking to extend its downside built after printing an all-time high of 19.52.
- The US Dollar Index has shifted below the crucial support of 103.50 ahead of the FOMC minutes.
- The South African Rand remained in a weak spot due to deepening tensions between South Africa and the US.
The pair currently trades last at 19.1992.
The previous day high was 19.3266 while the previous day low was 19.1597. The daily 38.2% Fib levels comes at 19.2234, expected to provide resistance. Similarly, the daily 61.8% fib level is at 19.2628, expected to provide resistance.
The USD/ZAR pair is struggling in holding its auction above the immediate support of 19.15 in the Asian session. The asset is expected to deliver more downside as the upside for the US Dollar Index (DXY) seems barricaded due to an absence of development in US debt-ceiling issues.
Decent gains have been generated in the Asian session by the S&P500 futures but are insufficient to cheer the overall market mood. US equities witnessed a sheer sell-off on Tuesday, weighed heavily by selling pressure on technology stocks. Investors are worried that a default by the United States economy due to a delay in US debt-ceiling raise would result in a loss of millions of jobs in the domestic economy and a ripple effect on global markets.
The US Dollar Index (DXY) has shifted below the crucial support of 103.50 ahead of the Federal Open Market Committee (FOMC) minutes. The street is eyeing cues about interest rate guidance. However, dovish commentary delivered by Federal Reserve (Fed) chair Jerome Powell last week is advocating no further interest rate hikes in June.
US firms are already facing issues in availing credit fur to tight conditions on disbursal by US regional banks. This would allow tight labor market conditions to lose some heat, which will have a negative impact on stubborn inflation as retail demand will get impacted significantly.
This week, USD/ZAR retreated firmly after posting all-time high at 19.52. The South African Rand remained in a weak spot due to deepening tensions between South Africa and the US. US ambassador accused South Africa of supplying arms to Russia. In response to that South African Finance Minister Godongwana claimed that the diplomatic row has been resolved, and it is unlikely to result in the US imposing penalties such as sanctions.”
Technical Levels: Supports and Resistances
USDZAR currently trading at 19.1931 at the time of writing. Pair opened at 19.2076 and is trading with a change of -0.08 % .
| Overview | Overview.1 | |
|---|---|---|
| 0 | Today last price | 19.1931 |
| 1 | Today Daily Change | -0.0145 |
| 2 | Today Daily Change % | -0.0800 |
| 3 | Today daily open | 19.2076 |
The pair remains strongly bullish on the daily timeframe. It trades above its 20 SMA @ 18.7912, 50 SMA 18.4364, 100 SMA @ 18.0524 and 200 SMA @ 17.7857.
| Trends | Trends.1 | |
|---|---|---|
| 0 | Daily SMA20 | 18.7912 |
| 1 | Daily SMA50 | 18.4364 |
| 2 | Daily SMA100 | 18.0524 |
| 3 | Daily SMA200 | 17.7857 |
The previous day high was 19.3266 while the previous day low was 19.1597. The daily 38.2% Fib levels comes at 19.2234, expected to provide resistance. Similarly, the daily 61.8% fib level is at 19.2628, expected to provide resistance.
Note the levels of interest below:
- Pivot support is noted at 19.136, 19.0644, 18.9691
- Pivot resistance is noted at 19.3028, 19.3981, 19.4697
| Levels | Levels.1 |
|---|---|
| Previous Daily High | 19.3266 |
| Previous Daily Low | 19.1597 |
| Previous Weekly High | 19.5250 |
| Previous Weekly Low | 18.9943 |
| Previous Monthly High | 18.5399 |
| Previous Monthly Low | 17.7526 |
| Daily Fibonacci 38.2% | 19.2234 |
| Daily Fibonacci 61.8% | 19.2628 |
| Daily Pivot Point S1 | 19.1360 |
| Daily Pivot Point S2 | 19.0644 |
| Daily Pivot Point S3 | 18.9691 |
| Daily Pivot Point R1 | 19.3028 |
| Daily Pivot Point R2 | 19.3981 |
| Daily Pivot Point R3 | 19.4697 |
[/s2If]
Nehcap Expert Advisor
The NEHCAP MT4 EA is high quality professional trading system geared to generate returns without using GRID or martingales. Each trade has strict risk per trade parameter. The pairs under management include EURUSD, GBPUSD, AUDCAD, AUDNZD,GBPAUD, EURAUD, EURCAD, CHFJPY and many more.
The system is trading live: LIVE ACCOUNT TRACKING
You can run it free. Apply for a free trial and track our account. Buy the system or use profit share mechanism to generate returns on your MT4.
Join Our Telegram Group


