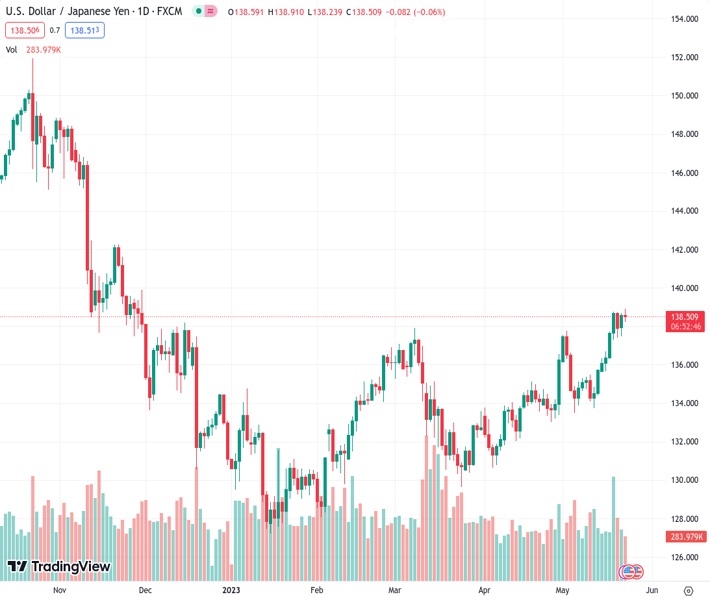
#USDJPY @ 138.425 remains confined in a range just below a fresh YTD peak touched this Tuesday. (Pivot Orderbook analysis)
…
This is a premium post.
[s2If !current_user_can(access_s2member_level4)]Please register for FREE REGISTER to read full post below containing analysis. In case of any error or you think you are not able to read the full post below, please email us at support#nehcap.com [lwa][/s2If] [s2If current_user_can(access_s2member_level1)]
- USD/JPY remains confined in a range just below a fresh YTD peak touched this Tuesday.
- The fundamental/technical backdrop favours bulls and supports prospects for further gains.
- Any meaningful slide is likely to get bought into and remain limited near the 200-day SMA.
The pair currently trades last at 138.425.
The previous day high was 138.69 while the previous day low was 137.49. The daily 38.2% Fib levels comes at 138.23, expected to provide support. Similarly, the daily 61.8% fib level is at 137.95, expected to provide support.
The USD/JPY pair consolidates its recent strong gains to the 139.00 neighbourhood, or a fresh YTD peak touched this Tuesday and seesaws between tepid gains/minor losses through the early North American session. The pair is currently placed just below mid-138.00s, down less than 0.15% for the day, though any meaningful retracement slide still seems elusive.
A combination of supporting factors pushes the US Dollar (USD) to a fresh two-months, which, in turn, is seen acting as a tailwind for the USD/JPY pair. The overnight hawkish remarks by a slew of Federal Reserve (Fed) officials reaffirmed expectations that the US central bank will keep interest rates higher for longer. This, along with hopes that US politicians can come together on a debt ceiling deal, remains supportive of elevated US Treasury bond yields and continues to benefit the Greenback.
A further rise in the US bond yields, meanwhile, widens the US-Japan rate differential and drives flow away from the Japanese Yen (JPY). Apart from this, a more dovish stance adopted by the Bank of Japan (BoJ) undermines the JPY and adds credence to the near-term positive outlook for the USD/JPY pair. That said, a softer risk tone – amid worries about slowing global economic growth – lends some support to the safe-haven JPY and keeps a lid on any further gains for the USD/JPY pair.
Even from a technical perspective, the recent breakout through the very important 200-day Simple Moving Average (SMA) and a subsequent move beyond the previous YTD peak favour bullish traders. The constructive setup is reinforced by the fact that oscillators on the daily chart are holding in the positive territory and are still far from being in the overbought zone. This, in turn, suggests that the path of least resistance for the USD/JPY pair is to the upside and any downtick is likely to get bought into.
Spot prices seem poised to surpass the 139.00 round-figure mark and test the next relevant hurdle near the 139.55-139.60 region. The upward trajectory could get extended further and allow the USD/JPY pair to reclaim the 140.00 psychological mark for the first time since November 2022.
On the flip side, the 138.00 round figure is likely to protect the immediate downside ahead of the 137.55-137.50 horizontal resistance breakpoint. Any further decline is likely to attract fresh buyers and remain limited near the 137.00 mark. The said handle coincides with the 200-day SMA and should act as a strong base for the USD/JPY pair. A convincing break below might prompt some technical selling and pave the way for some meaningful near-term corrective decline.
Technical Levels: Supports and Resistances
USDJPY currently trading at 138.48 at the time of writing. Pair opened at 138.6 and is trading with a change of -0.09 % .
| Overview | Overview.1 | |
|---|---|---|
| 0 | Today last price | 138.48 |
| 1 | Today Daily Change | -0.12 |
| 2 | Today Daily Change % | -0.09 |
| 3 | Today daily open | 138.60 |
The pair remains strongly bullish on the daily timeframe. It trades above its 20 SMA @ 135.79, 50 SMA 133.97, 100 SMA @ 133.22 and 200 SMA @ 137.15.
| Trends | Trends.1 | |
|---|---|---|
| 0 | Daily SMA20 | 135.79 |
| 1 | Daily SMA50 | 133.97 |
| 2 | Daily SMA100 | 133.22 |
| 3 | Daily SMA200 | 137.15 |
The previous day high was 138.69 while the previous day low was 137.49. The daily 38.2% Fib levels comes at 138.23, expected to provide support. Similarly, the daily 61.8% fib level is at 137.95, expected to provide support.
Note the levels of interest below:
- Pivot support is noted at 137.83, 137.06, 136.64
- Pivot resistance is noted at 139.03, 139.46, 140.22
| Levels | Levels.1 |
|---|---|
| Previous Daily High | 138.69 |
| Previous Daily Low | 137.49 |
| Previous Weekly High | 138.75 |
| Previous Weekly Low | 135.65 |
| Previous Monthly High | 136.56 |
| Previous Monthly Low | 130.63 |
| Daily Fibonacci 38.2% | 138.23 |
| Daily Fibonacci 61.8% | 137.95 |
| Daily Pivot Point S1 | 137.83 |
| Daily Pivot Point S2 | 137.06 |
| Daily Pivot Point S3 | 136.64 |
| Daily Pivot Point R1 | 139.03 |
| Daily Pivot Point R2 | 139.46 |
| Daily Pivot Point R3 | 140.22 |
[/s2If]
Nehcap Expert Advisor
The NEHCAP MT4 EA is high quality professional trading system geared to generate returns without using GRID or martingales. Each trade has strict risk per trade parameter. The pairs under management include EURUSD, GBPUSD, AUDCAD, AUDNZD,GBPAUD, EURAUD, EURCAD, CHFJPY and many more.
The system is trading live: LIVE ACCOUNT TRACKING
You can run it free. Apply for a free trial and track our account. Buy the system or use profit share mechanism to generate returns on your MT4.
Join Our Telegram Group


