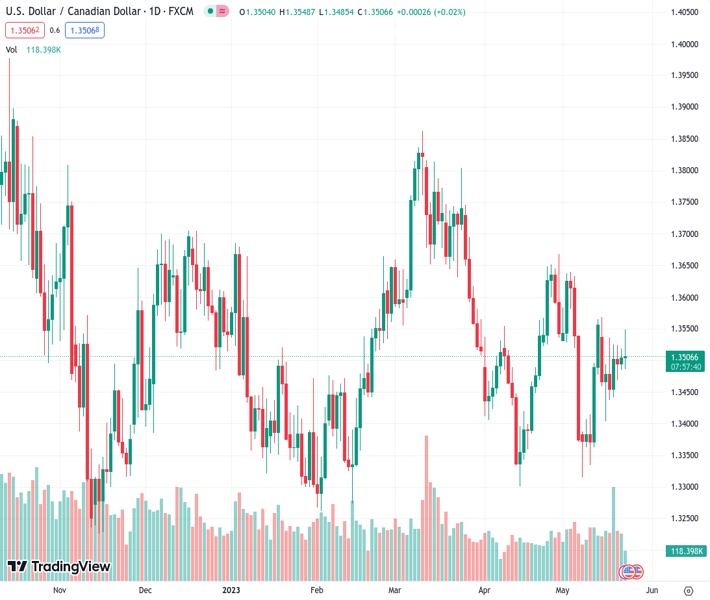
#USDCAD @ 1.35050 gains some positive traction and climbs to over a one-week high on Tuesday. (Pivot Orderbook analysis)
…
This is a premium post.
[s2If !current_user_can(access_s2member_level4)]Please register for FREE REGISTER to read full post below containing analysis. In case of any error or you think you are not able to read the full post below, please email us at support#nehcap.com [lwa][/s2If] [s2If current_user_can(access_s2member_level1)]
- USD/CAD gains some positive traction and climbs to over a one-week high on Tuesday.
- A combination of factors continues to push the USD higher and lend support to the pair.
- An intraday rise in Crude Oil prices underpins the Loonie and caps any meaningful gains.
The pair currently trades last at 1.35050.
The previous day high was 1.3519 while the previous day low was 1.3485. The daily 38.2% Fib levels comes at 1.3506, expected to provide resistance. Similarly, the daily 61.8% fib level is at 1.3498, expected to provide support.
The USD/CAD pair struggles to capitalize on its intraday positive move and retreats a few pips from the vicinity of mid-1.3500s, or over a one-week high touched earlier this Tuesday. The pair trades with a mild positive bias heading into the North American session and is currently placed just above the 1.3500 psychological mark.
Crude Oil prices rally over 1% amid hopes for an improvement in US fuel demand and disruptions in Canadian supply due to wildfires in the oil-rich Alberta province. This, in turn, underpins the commodity-linked Loonie and turns out to be a key factor acting as a headwind for the USD/CAD pair, though resurgent US Dollar (USD) demand should help limit the downside, at least for the time being. In fact, the USD Index (DXY), which tracks the Greenback against a basket of currencies, climbs to a fresh two-month high and draws support from a combination of factors.
The overnight hawkish remarks by a slew of influential Federal Reserve (Fed) officials lifted market bets that the US central bank will keep interest rates higher for longer. This, along with hopes that US politicians can come together on a debt ceiling deal, keeps the US Treasury bond yields elevated and continues to benefit the Greenback. Apart from this, worries over slowing global growth, particularly in China, further benefit the Greenback’s relative safe-haven status and contribute to limiting any meaningful pullback for the USD/CAD pair, at least for the time being.
Market participants now look forward to the US economic docket, featuring the flash PMI prints, New Home Sales data and the Richmond Manufacturing Index. This, along with the debt ceiling talks and the US bond yields, will influence the USD demand and provide some impetus to the USD/CAD pair. Traders will further take cues from Oil price dynamics to grab short-term opportunities. Meanwhile, the aforementioned mixed fundamental backdrop and the recent range-bound price action witnessed over the past week or so warrant some caution before placing directional bets.
Technical Levels: Supports and Resistances
USDCAD currently trading at 1.3516 at the time of writing. Pair opened at 1.3505 and is trading with a change of 0.08 % .
| Overview | Overview.1 | |
|---|---|---|
| 0 | Today last price | 1.3516 |
| 1 | Today Daily Change | 0.0011 |
| 2 | Today Daily Change % | 0.0800 |
| 3 | Today daily open | 1.3505 |
The pair is trading above its 20 Daily moving average @ 1.351, below its 50 Daily moving average @ 1.3536 , above its 100 Daily moving average @ 1.3509 and above its 200 Daily moving average @ 1.348
| Trends | Trends.1 | |
|---|---|---|
| 0 | Daily SMA20 | 1.3510 |
| 1 | Daily SMA50 | 1.3536 |
| 2 | Daily SMA100 | 1.3509 |
| 3 | Daily SMA200 | 1.3480 |
The previous day high was 1.3519 while the previous day low was 1.3485. The daily 38.2% Fib levels comes at 1.3506, expected to provide resistance. Similarly, the daily 61.8% fib level is at 1.3498, expected to provide support.
Note the levels of interest below:
- Pivot support is noted at 1.3487, 1.3469, 1.3453
- Pivot resistance is noted at 1.3521, 1.3537, 1.3555
| Levels | Levels.1 |
|---|---|
| Previous Daily High | 1.3519 |
| Previous Daily Low | 1.3485 |
| Previous Weekly High | 1.3568 |
| Previous Weekly Low | 1.3404 |
| Previous Monthly High | 1.3668 |
| Previous Monthly Low | 1.3301 |
| Daily Fibonacci 38.2% | 1.3506 |
| Daily Fibonacci 61.8% | 1.3498 |
| Daily Pivot Point S1 | 1.3487 |
| Daily Pivot Point S2 | 1.3469 |
| Daily Pivot Point S3 | 1.3453 |
| Daily Pivot Point R1 | 1.3521 |
| Daily Pivot Point R2 | 1.3537 |
| Daily Pivot Point R3 | 1.3555 |
[/s2If]
Nehcap Expert Advisor
The NEHCAP MT4 EA is high quality professional trading system geared to generate returns without using GRID or martingales. Each trade has strict risk per trade parameter. The pairs under management include EURUSD, GBPUSD, AUDCAD, AUDNZD,GBPAUD, EURAUD, EURCAD, CHFJPY and many more.
The system is trading live: LIVE ACCOUNT TRACKING
You can run it free. Apply for a free trial and track our account. Buy the system or use profit share mechanism to generate returns on your MT4.
Join Our Telegram Group


