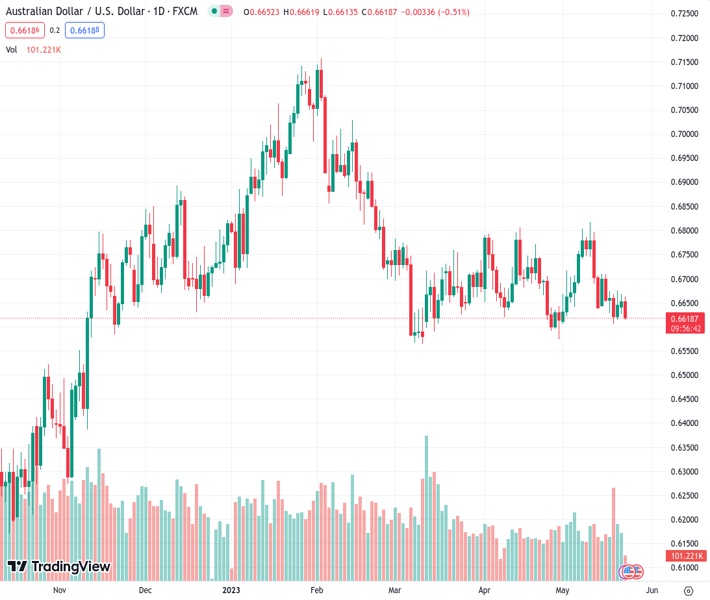
#AUDUSD @ 0.66195 meets with a fresh supply on Tuesday and is pressured by broad-based USD strength. (Pivot Orderbook analysis)
…
This is a premium post.
[s2If !current_user_can(access_s2member_level4)]Please register for FREE REGISTER to read full post below containing analysis. In case of any error or you think you are not able to read the full post below, please email us at support#nehcap.com [lwa][/s2If] [s2If current_user_can(access_s2member_level1)]
- AUD/USD meets with a fresh supply on Tuesday and is pressured by broad-based USD strength.
- Elevated US bond yields and looming recession risks lift the safe-haven USD to a two-month high.
- The fundamental backdrop favours bearish traders and supports prospects for a further decline.
The pair currently trades last at 0.66195.
The previous day high was 0.6668 while the previous day low was 0.6627. The daily 38.2% Fib levels comes at 0.6652, expected to provide resistance. Similarly, the daily 61.8% fib level is at 0.6643, expected to provide resistance.
The AUD/USD pair comes under heavy selling pressure on Tuesday and continues losing ground through the first half of the European session. Spot prices drop back closer to the monthly low touched last week, with bears now awaiting a sustained beak below the 0.6600 round-figure mark before placing fresh bets.
A combination of supporting factors lifts the US Dollar (USD) to its highest level since March 20, which, in turn, is seen weighing on the AUD/USD pair. The overnight hawkish remarks by a slew of influential Federal Reserve (Fed) officials lifted market bets that the US central bank will keep interest rates higher for longer. In fact, the markets are pricing in a small chance of another 25 bps lift-off at the June FOMC meeting. This, along with hopes that US politicians can come together on a debt ceiling deal, keeps the US Treasury bond yields elevated and continues to benefit the Greenback.
In fact, the yield on the benchmark 10-year US government bond rise for a seventh straight day on Monday and register its longest winning streak since April 2022. Apart from this, worries over slowing global growth, particularly in China, further benefit the safe-haven buck. It is worth recalling that data from China last week showed that the world’s second-largest economy underperformed in April. This, along with expectations that the Reserve Bank of Australia (RBA) might refrain from hiking in June, contributes to the offered tone surrounding the AUD/USD pair.
The aforementioned fundamental backdrop suggests that the path of least resistance for spot prices is to the downside. Some follow-through selling below the 0.6600 mark will reaffirm the negative bias and make the AUD/USD pair vulnerable to challenge the YTD low, around the 0.6565 region touched in March. Traders now look to the US economic docket, featuring the flash PMI prints, New Home Sales data and the Richmond Manufacturing Index. This, along with the debt ceiling talks, might influence the USD and produce short-term trading opportunities around the major.
Technical Levels: Supports and Resistances
AUDUSD currently trading at 0.6621 at the time of writing. Pair opened at 0.6652 and is trading with a change of -0.47 % .
| Overview | Overview.1 | |
|---|---|---|
| 0 | Today last price | 0.6621 |
| 1 | Today Daily Change | -0.0031 |
| 2 | Today Daily Change % | -0.4700 |
| 3 | Today daily open | 0.6652 |
The pair remains strongly bearish on the daily time frame. It trades below the 20 SMA @ 0.6675, 50 SMA 0.6687, 100 SMA @ 0.6784 and 200 SMA @ 0.6712.
| Trends | Trends.1 | |
|---|---|---|
| 0 | Daily SMA20 | 0.6675 |
| 1 | Daily SMA50 | 0.6687 |
| 2 | Daily SMA100 | 0.6784 |
| 3 | Daily SMA200 | 0.6712 |
The previous day high was 0.6668 while the previous day low was 0.6627. The daily 38.2% Fib levels comes at 0.6652, expected to provide resistance. Similarly, the daily 61.8% fib level is at 0.6643, expected to provide resistance.
Note the levels of interest below:
- Pivot support is noted at 0.663, 0.6609, 0.659
- Pivot resistance is noted at 0.6671, 0.6689, 0.6711
| Levels | Levels.1 |
|---|---|
| Previous Daily High | 0.6668 |
| Previous Daily Low | 0.6627 |
| Previous Weekly High | 0.6710 |
| Previous Weekly Low | 0.6605 |
| Previous Monthly High | 0.6806 |
| Previous Monthly Low | 0.6574 |
| Daily Fibonacci 38.2% | 0.6652 |
| Daily Fibonacci 61.8% | 0.6643 |
| Daily Pivot Point S1 | 0.6630 |
| Daily Pivot Point S2 | 0.6609 |
| Daily Pivot Point S3 | 0.6590 |
| Daily Pivot Point R1 | 0.6671 |
| Daily Pivot Point R2 | 0.6689 |
| Daily Pivot Point R3 | 0.6711 |
[/s2If]
Nehcap Expert Advisor
The NEHCAP MT4 EA is high quality professional trading system geared to generate returns without using GRID or martingales. Each trade has strict risk per trade parameter. The pairs under management include EURUSD, GBPUSD, AUDCAD, AUDNZD,GBPAUD, EURAUD, EURCAD, CHFJPY and many more.
The system is trading live: LIVE ACCOUNT TRACKING
You can run it free. Apply for a free trial and track our account. Buy the system or use profit share mechanism to generate returns on your MT4.
Join Our Telegram Group
")


