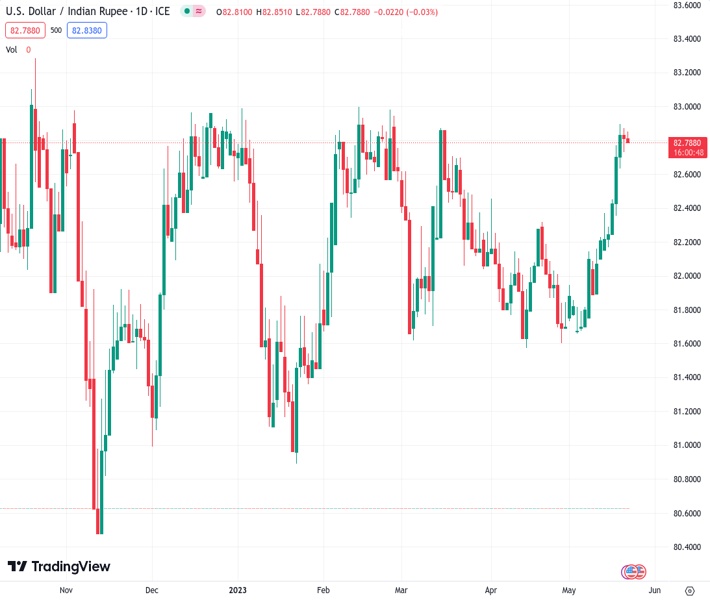
#USDINR @ 82.8050 is oscillating in a narrow range above 82.80 as investors are confused due to a further delay in US debt-ceiling issues. (Pivot Orderbook analysis)
…
This is a premium post.
[s2If !current_user_can(access_s2member_level4)]Please register for FREE REGISTER to read full post below containing analysis. In case of any error or you think you are not able to read the full post below, please email us at support#nehcap.com [lwa][/s2If] [s2If current_user_can(access_s2member_level1)]
- USD/INR is oscillating in a narrow range above 82.80 as investors are confused due to a further delay in US debt-ceiling issues.
- The USD Index is approaching the 103.50 resistance as Fed policymakers are confident of more rate hikes this year.
- The Indian economy is going through the buzz of a ban on Rs. 2000 notes by the Reserve Bank of India.
The pair currently trades last at 82.8050.
The previous day high was 82.9056 while the previous day low was 82.7375. The daily 38.2% Fib levels comes at 82.8017, expected to provide support. Similarly, the daily 61.8% fib level is at 82.8414, expected to provide resistance.
The USD/INR pair is displaying a back-and-forth action above 82.80 in the Asian session. The major is struggling to find direction as the US Dollar Index (DXY) remained choppy overnight amid a lack of clarity over the US debt-ceiling issues.
S&P500 futures have trimmed some losses generated in early Tokyo, however, the risk impulse is still solid. The US Dollar Index has turned sideways after a solid recovery from 103.16. The USD Index is approaching the 103.50 resistance as Federal Reserve (Fed) policymakers are confident that the policy-tightening spell by the central bank could pause in June but a finale is far from over.
St. Louis Fed Bank President James Bullard said on Monday that the Fed wants to fight inflation amid a strong labor market. He further added that the policy rate will have to go higher this year, perhaps by 50 basis points (bps). No doubt, the US labor market is showing resilience as job postings have not dropped dramatically despite higher interest rates and tight credit conditions by the US regional banks.
The USD Index is also showing resilience despite a further delay in US debt-ceiling issues. Monday’s meeting remained undecided as US President Joe Biden called the proposal from Republicans ‘extreme’. House of Representatives Kevin McCarthy denied the approval of higher taxes for the Wealthy community. While Democrats are not ready to cut budget spending wrath by 8%.
Meanwhile, the Indian economy is going through the buzz of a ban on Rs. 2000 notes by the Reserve Bank of India (RBI). The deadline for returning bigger-denomination notes is scheduled for September end.
Upside in the oil price seems restricted around $72.50 as investors are worried that US Treasury could announce a default by June 01 amid the absence of a raise in the US borrowing limit. It is worth noting that India is one of the leading importers of oil in the world and the India Rupee is silent due to sideways oil price.
Technical Levels: Supports and Resistances
USDINR currently trading at 82.8301 at the time of writing. Pair opened at 82.8293 and is trading with a change of 0.0 % .
| Overview | Overview.1 | |
|---|---|---|
| 0 | Today last price | 82.8301 |
| 1 | Today Daily Change | 0.0008 |
| 2 | Today Daily Change % | 0.0000 |
| 3 | Today daily open | 82.8293 |
The pair remains strongly bullish on the daily timeframe. It trades above its 20 SMA @ 82.0836, 50 SMA 82.1393, 100 SMA @ 82.1414 and 200 SMA @ 81.7931.
| Trends | Trends.1 | |
|---|---|---|
| 0 | Daily SMA20 | 82.0836 |
| 1 | Daily SMA50 | 82.1393 |
| 2 | Daily SMA100 | 82.1414 |
| 3 | Daily SMA200 | 81.7931 |
The previous day high was 82.9056 while the previous day low was 82.7375. The daily 38.2% Fib levels comes at 82.8017, expected to provide support. Similarly, the daily 61.8% fib level is at 82.8414, expected to provide resistance.
Note the levels of interest below:
- Pivot support is noted at 82.7427, 82.6561, 82.5746
- Pivot resistance is noted at 82.9107, 82.9922, 83.0788
| Levels | Levels.1 |
|---|---|
| Previous Daily High | 82.9056 |
| Previous Daily Low | 82.7375 |
| Previous Weekly High | 82.9554 |
| Previous Weekly Low | 82.1655 |
| Previous Monthly High | 82.5092 |
| Previous Monthly Low | 81.4850 |
| Daily Fibonacci 38.2% | 82.8017 |
| Daily Fibonacci 61.8% | 82.8414 |
| Daily Pivot Point S1 | 82.7427 |
| Daily Pivot Point S2 | 82.6561 |
| Daily Pivot Point S3 | 82.5746 |
| Daily Pivot Point R1 | 82.9107 |
| Daily Pivot Point R2 | 82.9922 |
| Daily Pivot Point R3 | 83.0788 |
[/s2If]
Nehcap Expert Advisor
The NEHCAP MT4 EA is high quality professional trading system geared to generate returns without using GRID or martingales. Each trade has strict risk per trade parameter. The pairs under management include EURUSD, GBPUSD, AUDCAD, AUDNZD,GBPAUD, EURAUD, EURCAD, CHFJPY and many more.
The system is trading live: LIVE ACCOUNT TRACKING
You can run it free. Apply for a free trial and track our account. Buy the system or use profit share mechanism to generate returns on your MT4.
Join Our Telegram Group
")


