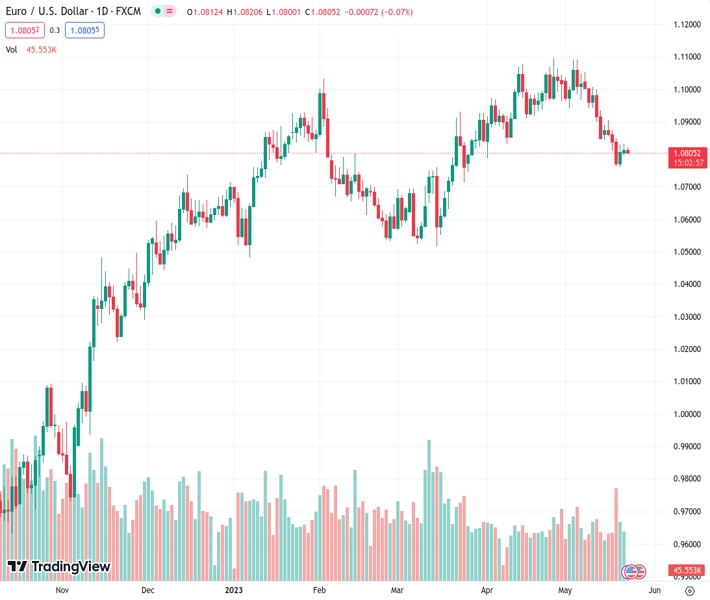
#EURUSD @ 1.08050 is oscillating above 1.0800 as investors are confused over further action after Monday’s US debt-ceiling meet ended without agreement. (Pivot Orderbook analysis)
…
This is a premium post.
[s2If !current_user_can(access_s2member_level4)]Please register for FREE REGISTER to read full post below containing analysis. In case of any error or you think you are not able to read the full post below, please email us at support#nehcap.com [lwa][/s2If] [s2If current_user_can(access_s2member_level1)]
- EUR/USD is oscillating above 1.0800 as investors are confused over further action after Monday’s US debt-ceiling meet ended without agreement.
- Federal Reserve policymakers delivered mixed responses on interest rate guidance as June’s monetary policy is approaching faster.
- European Central Bank has already warned that more than one interest rate hike is appropriate to bring down sticky inflation.
- EUR/USD is making efforts for shifting comfortably above the 50% Fibonacci retracement at 1.0806.
The pair currently trades last at 1.08050.
The previous day high was 1.0831 while the previous day low was 1.0796. The daily 38.2% Fib levels comes at 1.0818, expected to provide resistance. Similarly, the daily 61.8% fib level is at 1.0809, expected to provide resistance.
EUR/USD is continuously auctioning in a narrow range above the round-level support of 1.0800 in the Asian session. The major currency pair is struggling to deliver a decisive move as investors have got confused after Monday’s meeting between US Biden and House of Representatives Kevin McCarthy concluded without an agreement but remained constructive at best.
S&P500 futures have surrendered some gains added in Asia as investors are getting worried due to continuous warnings from US Treasury Secretary Janet Yellen that the United States Federal will be out of funds by June 1 in addressing its obligated payments. The risk appetite theme is fading gradually but is not outside the overall picture.
The US Dollar Index (DXY) has sensed barricades around 103.30 after a solid recovery move. The street is confused whether the US Dollar should be pushed into a positive trajectory due to hawkish commentaries from Federal Reserve (Fed) policymakers or to punish the same as fears of a default by the United States are skyrocketing.
Investors were keenly focusing on Monday’s US President Joe Biden-House of Speaker Kevin McCarthy face-to-face negotiations for raising the US debt-ceiling limit. However, the two-hour-long meeting ended without an agreement. US Biden has called partisan terms from Republicans as ‘extreme’ as the latter is not allowing extra taxes on the Wealthy community despite Democrats getting ready for some spending cuts. Republican McCarthy wants an 8% cut in overall spending in the budget for CY2024. Republicans want Democrats to return to the CY2022 budget scheme to avoid a further budget deficit.
Meanwhile, US Treasury Secretary Janet Yellen is constantly reminding related authorities that the United States economy is moving towards a default swiftly as June 01 is the deadline for addressing obligated payments.
Various Federal Reserve policymakers delivered their responses on interest rate guidance on Monday as June’s monetary policy is approaching faster. The street is getting mixed views as Minneapolis Fed Bank President Neel Kashkari cited that he would support the Fed for holding interest rates in June. On Monday, he told Reuters that it may appear like the worst period of the banking turmoil is over but history showed more trouble can’t be ruled out.
On the contrary, St. Louis Fed Bank President James Bullard said on Monday that the Fed wants to fight inflation amid a strong labor market. He further added that the policy rate will have to go higher this year, perhaps by 50 basis points (bps).
In Eurozone, inflationary pressures are extremely stubborn as a decline in food prices has been offset by labor shortages, which have resulted in wage growth. European Central Bank (ECB) President Christine Lagarde has already warned that more than one interest rate hike is appropriate to bring down sticky inflation.
On Monday, European Central Bank policymaker Francois Villeroy de Galhau said “I expect today that we will be at the terminal rate not later than by summer,” He further added, “Deceleration in rate increases from 50 bp to 25 bp was wise and cautious.” This has allowed the ECB to push its interest rate cycle longer and has safeguarded the economy from any interest rate shocks.
EUR/USD is making efforts for shifting comfortably above the 50% Fibonacci retracement (plotted from March 15 low at 1.0516 to April 26 high at 1.1095) at 1.0806 on a four-hour scale. The 20-period Exponential Moving Average (EMA) at 1.0813 is acting as a strong barrier for the Euro bulls.
A range shift move by the Relative Strength Index (RSI) (14) into the 40.00-60.00 zone from the bearish territory of 20.00-40.00 indicates that the downside momentum has faded for now.
Technical Levels: Supports and Resistances
EURUSD currently trading at 1.081 at the time of writing. Pair opened at 1.0813 and is trading with a change of -0.03 % .
| Overview | Overview.1 | |
|---|---|---|
| 0 | Today last price | 1.0810 |
| 1 | Today Daily Change | -0.0003 |
| 2 | Today Daily Change % | -0.0300 |
| 3 | Today daily open | 1.0813 |
The pair is trading below its 20 Daily moving average @ 1.0941, below its 50 Daily moving average @ 1.0896 , above its 100 Daily moving average @ 1.0809 and above its 200 Daily moving average @ 1.047
| Trends | Trends.1 | |
|---|---|---|
| 0 | Daily SMA20 | 1.0941 |
| 1 | Daily SMA50 | 1.0896 |
| 2 | Daily SMA100 | 1.0809 |
| 3 | Daily SMA200 | 1.0470 |
The previous day high was 1.0831 while the previous day low was 1.0796. The daily 38.2% Fib levels comes at 1.0818, expected to provide resistance. Similarly, the daily 61.8% fib level is at 1.0809, expected to provide resistance.
Note the levels of interest below:
- Pivot support is noted at 1.0795, 1.0777, 1.0759
- Pivot resistance is noted at 1.0831, 1.0849, 1.0867
| Levels | Levels.1 |
|---|---|
| Previous Daily High | 1.0831 |
| Previous Daily Low | 1.0796 |
| Previous Weekly High | 1.0904 |
| Previous Weekly Low | 1.0760 |
| Previous Monthly High | 1.1095 |
| Previous Monthly Low | 1.0788 |
| Daily Fibonacci 38.2% | 1.0818 |
| Daily Fibonacci 61.8% | 1.0809 |
| Daily Pivot Point S1 | 1.0795 |
| Daily Pivot Point S2 | 1.0777 |
| Daily Pivot Point S3 | 1.0759 |
| Daily Pivot Point R1 | 1.0831 |
| Daily Pivot Point R2 | 1.0849 |
| Daily Pivot Point R3 | 1.0867 |
[/s2If]
Nehcap Expert Advisor
The NEHCAP MT4 EA is high quality professional trading system geared to generate returns without using GRID or martingales. Each trade has strict risk per trade parameter. The pairs under management include EURUSD, GBPUSD, AUDCAD, AUDNZD,GBPAUD, EURAUD, EURCAD, CHFJPY and many more.
The system is trading live: LIVE ACCOUNT TRACKING
You can run it free. Apply for a free trial and track our account. Buy the system or use profit share mechanism to generate returns on your MT4.
Join Our Telegram Group
")


