Asian markets are cautious as US debt-ceiling negotiations ended without any agreement. (Pivot Orderbook analysis)
…
This is a premium post.
[s2If !current_user_can(access_s2member_level4)]Please register for FREE REGISTER to read full post below containing analysis. In case of any error or you think you are not able to read the full post below, please email us at support#nehcap.com [lwa][/s2If] [s2If current_user_can(access_s2member_level1)]
- Asian markets are cautious as US debt-ceiling negotiations ended without any agreement.
- The USD Index has turned sideways around 103.30 as investors are confused about further action in the FX domain.
- Japanese equities have failed to capitalize on strong May PMI numbers.
The pair currently trades last at 31203.24.
The previous day high was 31275.59 while the previous day low was 30855.29. The daily 38.2% Fib levels comes at 31115.04, expected to provide support. Similarly, the daily 61.8% fib level is at 31015.84, expected to provide support.
Markets in the Asian domain are cautious as US debt-ceiling negotiations ended without any agreement that has pushed the United States economy further towards a default situation. The street was anticipating a decisive outcome of US Biden-McCarthy talks as the US borrowing cap issues have reached do-or-die time.
At the press time, Japan’s Nikkei 225 dropped 0.55%, ChinaA50 tumbled 0.88%, Hang Seng slipped 0.45%, and Nifty50 gained 0.47%.
The US Dollar Index has turned sideways around 103.30 as investors are confused about further action in the FX domain. The street is baffled about whether to support the USD index after hawkish commentaries from Federal Reserve (Fed) policymakers or to punish it due to further delay in US borrowing cap issues. An absence of selling action in the USD Index indicates that investors are confident that the US debt-ceiling will get raised ahead.
Japanese equities have failed to capitalize on strong PMI numbers. Manufacturing PMI jumped to 50.8 vs. the estimates of 49.5 while Services PMI soared to 56.3 against the estimates of 55.2. The Japanese economy is showing resilience as PMI numbers have soared after a significant expansion in Q1 Gross Domestic Product (GDP).
Chinese stocks are facing heat despite positive development in US-China trade relations. China’s Commerce Minister Wang Wentao hosts a seminar for US firms investing in China on Monday and promised to provide accurate and efficient service guarantees for foreign-funded enterprises.
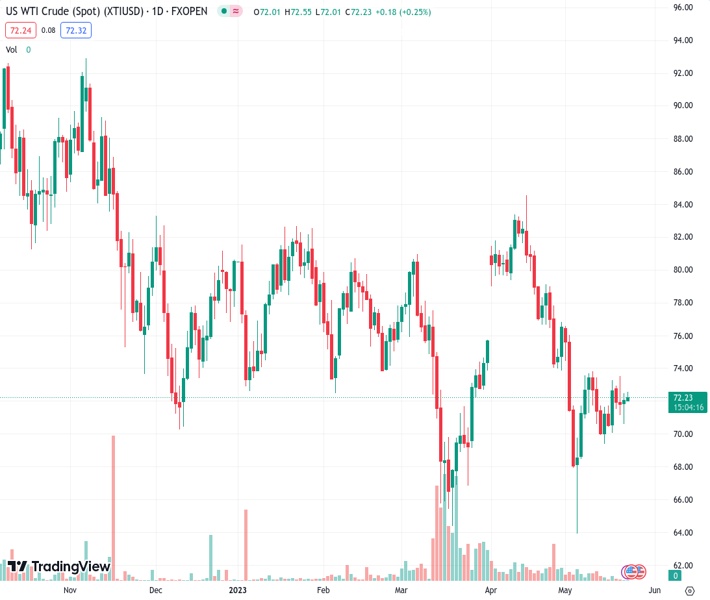
On the oil front, the oil price is facing barricades around $72.50 amid a further delay in US dent-ceiling negotiations.
Technical Levels: Supports and Resistances
XTIUSD currently trading at 31203.24 at the time of writing. Pair opened at 31203.24 and is trading with a change of 0.0 % .
| Overview | Overview.1 | |
|---|---|---|
| 0 | Today last price | 31203.24 |
| 1 | Today Daily Change | 0.00 |
| 2 | Today Daily Change % | 0.00 |
| 3 | Today daily open | 31203.24 |
The pair remains strongly bullish on the daily timeframe. It trades above its 20 SMA @ 29397.6, 50 SMA 28485.19, 100 SMA @ 27855.75 and 200 SMA @ 27682.92.
| Trends | Trends.1 | |
|---|---|---|
| 0 | Daily SMA20 | 29397.60 |
| 1 | Daily SMA50 | 28485.19 |
| 2 | Daily SMA100 | 27855.75 |
| 3 | Daily SMA200 | 27682.92 |
The previous day high was 31275.59 while the previous day low was 30855.29. The daily 38.2% Fib levels comes at 31115.04, expected to provide support. Similarly, the daily 61.8% fib level is at 31015.84, expected to provide support.
Note the levels of interest below:
- Pivot support is noted at 30947.16, 30691.07, 30526.86
- Pivot resistance is noted at 31367.46, 31531.67, 31787.76
| Levels | Levels.1 |
|---|---|
| Previous Daily High | 31275.59 |
| Previous Daily Low | 30855.29 |
| Previous Weekly High | 30973.59 |
| Previous Weekly Low | 29607.53 |
| Previous Monthly High | 29058.52 |
| Previous Monthly Low | 27562.51 |
| Daily Fibonacci 38.2% | 31115.04 |
| Daily Fibonacci 61.8% | 31015.84 |
| Daily Pivot Point S1 | 30947.16 |
| Daily Pivot Point S2 | 30691.07 |
| Daily Pivot Point S3 | 30526.86 |
| Daily Pivot Point R1 | 31367.46 |
| Daily Pivot Point R2 | 31531.67 |
| Daily Pivot Point R3 | 31787.76 |
[/s2If]
Nehcap Expert Advisor
The NEHCAP MT4 EA is high quality professional trading system geared to generate returns without using GRID or martingales. Each trade has strict risk per trade parameter. The pairs under management include EURUSD, GBPUSD, AUDCAD, AUDNZD,GBPAUD, EURAUD, EURCAD, CHFJPY and many more.
The system is trading live: LIVE ACCOUNT TRACKING
You can run it free. Apply for a free trial and track our account. Buy the system or use profit share mechanism to generate returns on your MT4.
Join Our Telegram Group
")


