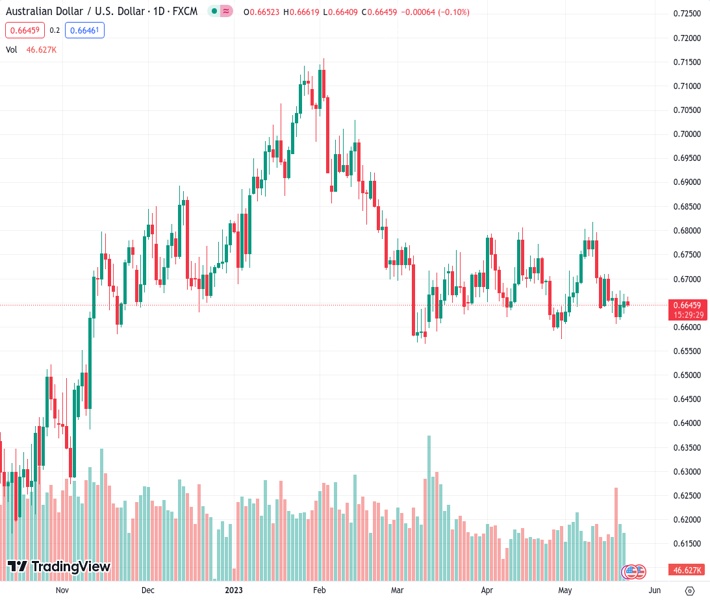
#AUDUSD @ 0.66480 fades bounce off intraday low, turns bearish after sluggish week-start. (Pivot Orderbook analysis)
…
This is a premium post.
[s2If !current_user_can(access_s2member_level4)]Please register for FREE REGISTER to read full post below containing analysis. In case of any error or you think you are not able to read the full post below, please email us at support#nehcap.com [lwa][/s2If] [s2If current_user_can(access_s2member_level1)]
- AUD/USD fades bounce off intraday low, turns bearish after sluggish week-start.
- Mixed prints of Aussie PMIs, hawkish Fed concerns join hopes of no US default to weigh on AUD/USD.
- Cautious optimism in the markets, sluggish yields fail to lure bulls.
The pair currently trades last at 0.66480.
The previous day high was 0.6668 while the previous day low was 0.6627. The daily 38.2% Fib levels comes at 0.6652, expected to provide resistance. Similarly, the daily 61.8% fib level is at 0.6643, expected to provide support.
AUD/USD portrays a downbeat performance on early Tuesday, following a sluggish start of the week, as it takes offers to reverse the mid-Asian session rebound from intraday low to print mild losses around 0.6650 by the press time.
In doing so, the Aussie pair bears the burden of the firmer US Dollar amid hopes of avoiding the US default, despite US President Joe Biden and House Speaker Kevin McCarthy’s failure to offer a deal to avoid the debt ceiling expiry during the latest negotiations. That said, US Dollar Index (DXY) grinds higher around 103.30 during the two-day uptrend by the press time.
On the other hand, the preliminary readings of Australia’s S&P Global PMIs for May came mixed as the Manufacturing gauge reprints 48.0 figures versus 47.3 expected whereas the Services PMI eased to 51.8 from 53.7 previous readings and 48.9 market forecasts. Further, the Composite PMI came in at 51.2 compared to 53.0 marked in April.
Elsewhere, the challenges to sentiment due to the latest West versus Russia tension and the G7 versus China tussles also weigh on the Aussie pair. Recently, Russia flaunts its ties with China and said the trade turnover may reach $200 billion, which in turn makes China more despicable to the West. Considering Australia’s ties with China, such developments keep AUD/USD grounded.
Furthermore, the recent run-up in the odds favoring the Federal Reserve’s (Fed) 0.25% rate hike in June, as well as no rate cuts in 2023, versus the Reserve Bank of Australia’s (RBA) dovish hike, also keeps the AUD/USD bears hopeful.
Against this backdrop, S&P500 Futures remain mildly bid near 4,220, up for the second consecutive day as it reverses Friday’s pullback from a nine-month high. With the upbeat US stock Futures, as well as the mildly positive performance of Wall Street, the benchmark 10-year and two-year US Treasury bond yields pause a five-day uptrend at the highest levels in two months.
Looking ahead, the US first readings of S&P Global Purchasing Managers Indexes (PMIs) for May will be important for the AUD/USD traders to watch for clear directions. Also important will be the US debt ceiling negotiations and the Fed talks.
Given the AUD/USD pair’s Doji candlestick printed on Monday, as well as the pair’s sustained trading below the 21-DMA, close to 0.6675 by the press time, the bears are likely to approach a one-month-old ascending support line, around 0.6610 at the latest.
Technical Levels: Supports and Resistances
AUDUSD currently trading at 0.6647 at the time of writing. Pair opened at 0.6652 and is trading with a change of -0.08% % .
| Overview | Overview.1 | |
|---|---|---|
| 0 | Today last price | 0.6647 |
| 1 | Today Daily Change | -0.0005 |
| 2 | Today Daily Change % | -0.08% |
| 3 | Today daily open | 0.6652 |
The pair remains strongly bearish on the daily time frame. It trades below the 20 SMA @ 0.6675, 50 SMA 0.6687, 100 SMA @ 0.6784 and 200 SMA @ 0.6712.
| Trends | Trends.1 | |
|---|---|---|
| 0 | Daily SMA20 | 0.6675 |
| 1 | Daily SMA50 | 0.6687 |
| 2 | Daily SMA100 | 0.6784 |
| 3 | Daily SMA200 | 0.6712 |
The previous day high was 0.6668 while the previous day low was 0.6627. The daily 38.2% Fib levels comes at 0.6652, expected to provide resistance. Similarly, the daily 61.8% fib level is at 0.6643, expected to provide support.
Note the levels of interest below:
- Pivot support is noted at 0.663, 0.6609, 0.659
- Pivot resistance is noted at 0.6671, 0.6689, 0.6711
| Levels | Levels.1 |
|---|---|
| Previous Daily High | 0.6668 |
| Previous Daily Low | 0.6627 |
| Previous Weekly High | 0.6710 |
| Previous Weekly Low | 0.6605 |
| Previous Monthly High | 0.6806 |
| Previous Monthly Low | 0.6574 |
| Daily Fibonacci 38.2% | 0.6652 |
| Daily Fibonacci 61.8% | 0.6643 |
| Daily Pivot Point S1 | 0.6630 |
| Daily Pivot Point S2 | 0.6609 |
| Daily Pivot Point S3 | 0.6590 |
| Daily Pivot Point R1 | 0.6671 |
| Daily Pivot Point R2 | 0.6689 |
| Daily Pivot Point R3 | 0.6711 |
[/s2If]
Nehcap Expert Advisor
The NEHCAP MT4 EA is high quality professional trading system geared to generate returns without using GRID or martingales. Each trade has strict risk per trade parameter. The pairs under management include EURUSD, GBPUSD, AUDCAD, AUDNZD,GBPAUD, EURAUD, EURCAD, CHFJPY and many more.
The system is trading live: LIVE ACCOUNT TRACKING
You can run it free. Apply for a free trial and track our account. Buy the system or use profit share mechanism to generate returns on your MT4.
Join Our Telegram Group
")


