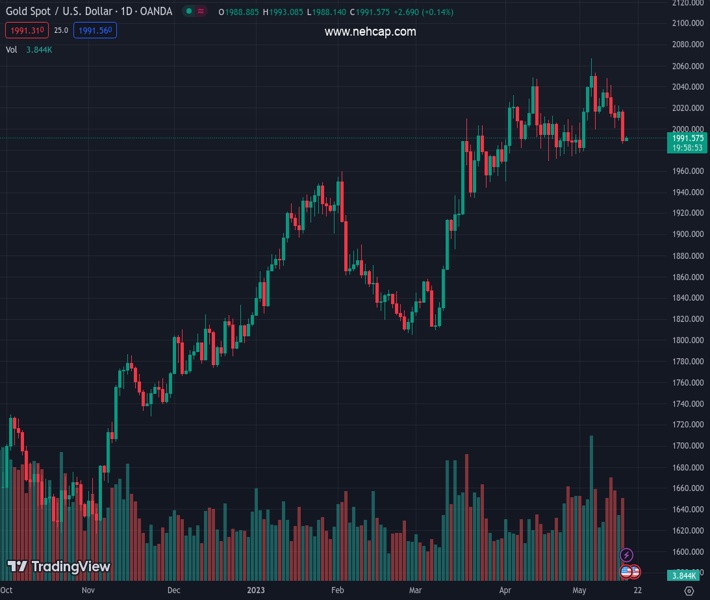
#XAUUSD @ 1,991.95 Gold price is retesting the breakdown of the Rising Channel pattern amid a delay in US debt-ceiling issues. (Pivot Orderbook analysis)
…
This is a premium post.
[s2If !current_user_can(access_s2member_level4)]Please register for FREE REGISTER to read full post below containing analysis. In case of any error or you think you are not able to read the full post below, please email us at support#nehcap.com [lwa][/s2If] [s2If current_user_can(access_s2member_level1)]
- Gold price is retesting the breakdown of the Rising Channel pattern amid a delay in US debt-ceiling issues.
- A slower pace in the expansion of US Retail Sales has strengthened expectations of a steady monetary policy stance by the Fed.
- The postponement of approval for the debt-ceiling cap has improved demand for US government bonds.
The pair currently trades last at 1991.95.
The previous day high was 2018.38 while the previous day low was 1985.53. The daily 38.2% Fib levels comes at 1998.08, expected to provide resistance. Similarly, the daily 61.8% fib level is at 2005.83, expected to provide resistance.
Gold price (XAU/USD) has shown some buying interest after dropping below $1,990.00 in the Tokyo session. The precious metal has witnessed some recovery as the US Dollar Index (DXY) is struggling in extending its upside move further above 102.70. The Gold price has yet not developed a strong upside bias as it needs to pass through more filters for gaining traction.
S&P500 futures have added decent gains in Asia despite the postponement of approval for raising the US Treasury borrowing cap limit. One thing is for sure that the approval of default is off the table. Every delegate has admitted that the US debt-ceiling cannot be raised along with bulking spending initiatives as it could be a disaster.
The postponement of approval for the debt-ceiling cap has improved demand for US government bonds. This has led to a decline in 10-year US Treasury yields to 3.53%.
The USD Index is facing barricades in extending its recovery above 102.70 as a slower pace in the expansion of US Retail Sales has strengthened expectations of a steady monetary policy stance by the Federal Reserve (Fed). The economic data expanded at a slower pace of 0.4% against the estimate of 0.7%. A mild expansion is insufficient to impact expectations for a steady monetary policy by the Fed.
Gold price has delivered a breakdown of the Rising Channel chart pattern formed on a four-hour scale, however, the breakdown needs to pass some more filters yet. An intermediate resistance is plotted from May 05 low at $1,999.54. Downward-sloping 10-period Exponential Moving Average (EMA) at $2,000.00 is barricading the Gold bulls.
The Relative Strength Index (RSI) (14) has slipped into the bearish range of 20.00-40.00, which indicates more downside ahead.
Technical Levels: Supports and Resistances
XAUUSD currently trading at 1992.58 at the time of writing. Pair opened at 1989.22 and is trading with a change of 0.17 % .
| Overview | Overview.1 | |
|---|---|---|
| 0 | Today last price | 1992.58 |
| 1 | Today Daily Change | 3.36 |
| 2 | Today Daily Change % | 0.17 |
| 3 | Today daily open | 1989.22 |
The pair is trading below its 20 Daily moving average @ 2007.91, above its 50 Daily moving average @ 1978.5 , above its 100 Daily moving average @ 1924.06 and above its 200 Daily moving average @ 1823.15
| Trends | Trends.1 | |
|---|---|---|
| 0 | Daily SMA20 | 2007.91 |
| 1 | Daily SMA50 | 1978.50 |
| 2 | Daily SMA100 | 1924.06 |
| 3 | Daily SMA200 | 1823.15 |
The previous day high was 2018.38 while the previous day low was 1985.53. The daily 38.2% Fib levels comes at 1998.08, expected to provide resistance. Similarly, the daily 61.8% fib level is at 2005.83, expected to provide resistance.
Note the levels of interest below:
- Pivot support is noted at 1977.04, 1964.86, 1944.19
- Pivot resistance is noted at 2009.89, 2030.56, 2042.74
| Levels | Levels.1 |
|---|---|
| Previous Daily High | 2018.38 |
| Previous Daily Low | 1985.53 |
| Previous Weekly High | 2048.27 |
| Previous Weekly Low | 2000.95 |
| Previous Monthly High | 2048.75 |
| Previous Monthly Low | 1949.83 |
| Daily Fibonacci 38.2% | 1998.08 |
| Daily Fibonacci 61.8% | 2005.83 |
| Daily Pivot Point S1 | 1977.04 |
| Daily Pivot Point S2 | 1964.86 |
| Daily Pivot Point S3 | 1944.19 |
| Daily Pivot Point R1 | 2009.89 |
| Daily Pivot Point R2 | 2030.56 |
| Daily Pivot Point R3 | 2042.74 |
[/s2If]
Nehcap Expert Advisor
The NEHCAP MT4 EA is high quality professional trading system geared to generate returns without using GRID or martingales. Each trade has strict risk per trade parameter. The pairs under management include EURUSD, GBPUSD, AUDCAD, AUDNZD,GBPAUD, EURAUD, EURCAD, CHFJPY and many more.
The system is trading live: LIVE ACCOUNT TRACKING
You can run it free. Apply for a free trial and track our account. Buy the system or use profit share mechanism to generate returns on your MT4.
Join Our Telegram Group


