Oil price is defending its crucial support of $70.50 ahead of US oil inventory data. (Pivot Orderbook analysis)
…
This is a premium post.
[s2If !current_user_can(access_s2member_level4)]Please register for FREE REGISTER to read full post below containing analysis. In case of any error or you think you are not able to read the full post below, please email us at support#nehcap.com [lwa][/s2If] [s2If current_user_can(access_s2member_level1)]
- Oil price is defending its crucial support of $70.50 ahead of US oil inventory data.
- Postponement of approval for increasing US debt-ceiling limit has deepened fears of US recession.
- Oil price is auctioning in an Ascending Triangle chart pattern, which indicates a sheer contraction in volatility.
The pair currently trades last at 70.63.
The previous day high was 71.76 while the previous day low was 70.45. The daily 38.2% Fib levels comes at 70.8, expected to provide resistance. Similarly, the daily 61.8% fib level is at 70.26, expected to provide support.
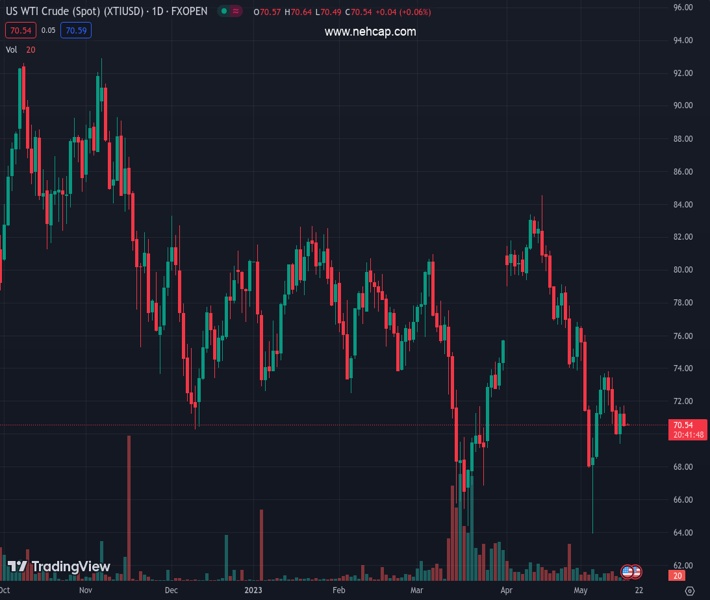
West Texas Intermediate (WTI), futures on NYMEX, have defended their immediate support of $70.50 in the Asian session. Earlier, the oil price slipped sharply as investors are worried that further postponement of approval for increasing the US debt-ceiling limit has deepened fears of a recession in the United States economy.
The US Dollar Index (DXY) is aiming to stretch its recovery above 102.70 as investors have turned cautious due to an absence of a meaningful outcome from US debt-ceiling negotiations.
On Wednesday, investors will keep an eye on the oil inventories data to be reported by the United States Energy Information Administration (EIA) for the week ending May 12.
Oil prices are auctioning in an Ascending Triangle chart pattern on an hourly scale, which indicates a sheer contraction in volatility. The upward-sloping trendline of the chart pattern is placed from May 15 low at $69.39 while the horizontal resistance is plotted from May 12 high at $71.74. The black gold price is hovering near the upward-sloping trendline of the aforementioned pattern, advocating a downside bias.
The 20-period Exponential Moving Average (EMA) at $70.80 is stuck to the oil price, indicating a lackluster performance.
Also, the Relative Strength Index (RSI) (14) is oscillating in the 40.00-60.00, which signals that investors are awaiting a fresh trigger for further action.
Going forward, a breakdown of 15 low at $69.39 will strengthen the downside bias and will send the oil price to May 04 low at $67.47. A breakdown of the latter will further send the asset price toward a 17-month low at $64.31.
In an alternate scenario, a solid recovery above May 10 high at $73.80 will allow the asset for further upside towards May 02 high at $76.06. A breach of the latter will expose the asset to April 26 high around $78.00.
Technical Levels: Supports and Resistances
XTIUSD currently trading at 70.63 at the time of writing. Pair opened at 70.54 and is trading with a change of 0.13 % .
| Overview | Overview.1 | |
|---|---|---|
| 0 | Today last price | 70.63 |
| 1 | Today Daily Change | 0.09 |
| 2 | Today Daily Change % | 0.13 |
| 3 | Today daily open | 70.54 |
The pair remains strongly bearish on the daily time frame. It trades below the 20 SMA @ 73.64, 50 SMA 74.76, 100 SMA @ 76.41 and 200 SMA @ 80.3.
| Trends | Trends.1 | |
|---|---|---|
| 0 | Daily SMA20 | 73.64 |
| 1 | Daily SMA50 | 74.76 |
| 2 | Daily SMA100 | 76.41 |
| 3 | Daily SMA200 | 80.30 |
The previous day high was 71.76 while the previous day low was 70.45. The daily 38.2% Fib levels comes at 70.8, expected to provide resistance. Similarly, the daily 61.8% fib level is at 70.26, expected to provide support.
Note the levels of interest below:
- Pivot support is noted at 70.07, 69.61, 68.76
- Pivot resistance is noted at 71.38, 72.23, 72.69
| Levels | Levels.1 |
|---|---|
| Previous Daily High | 71.76 |
| Previous Daily Low | 70.45 |
| Previous Weekly High | 73.81 |
| Previous Weekly Low | 69.94 |
| Previous Monthly High | 83.40 |
| Previous Monthly Low | 73.88 |
| Daily Fibonacci 38.2% | 70.80 |
| Daily Fibonacci 61.8% | 70.26 |
| Daily Pivot Point S1 | 70.07 |
| Daily Pivot Point S2 | 69.61 |
| Daily Pivot Point S3 | 68.76 |
| Daily Pivot Point R1 | 71.38 |
| Daily Pivot Point R2 | 72.23 |
| Daily Pivot Point R3 | 72.69 |
[/s2If]
Nehcap Expert Advisor
The NEHCAP MT4 EA is high quality professional trading system geared to generate returns without using GRID or martingales. Each trade has strict risk per trade parameter. The pairs under management include EURUSD, GBPUSD, AUDCAD, AUDNZD,GBPAUD, EURAUD, EURCAD, CHFJPY and many more.
The system is trading live: LIVE ACCOUNT TRACKING
You can run it free. Apply for a free trial and track our account. Buy the system or use profit share mechanism to generate returns on your MT4.
Join Our Telegram Group


