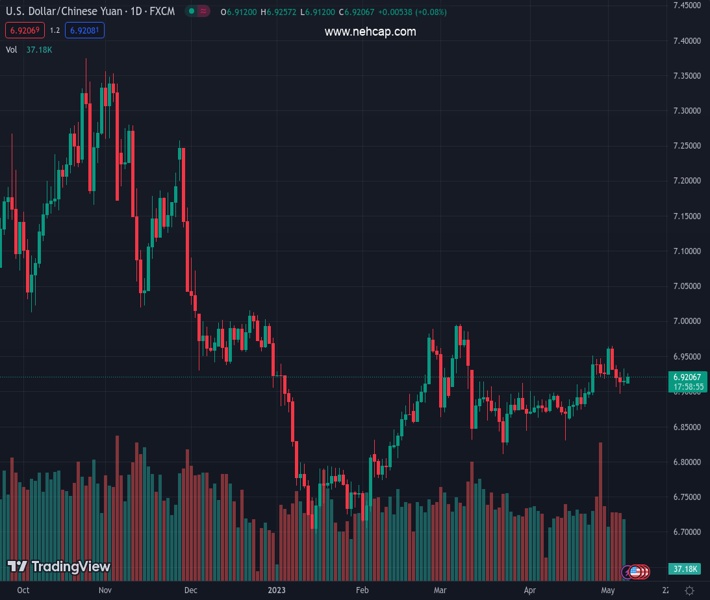
#USDCNH @ 6.92005 remains sidelined between 200-SMA and 50-SMA, portrays bullish megaphone trend-widening formation., @nehcap view: Further upside expected (Pivot Orderbook analysis)
…
This is a premium post.
[s2If !current_user_can(access_s2member_level4)]Please register for FREE REGISTER to read full post below containing analysis. In case of any error or you think you are not able to read the full post below, please email us at support#nehcap.com [lwa][/s2If] [s2If current_user_can(access_s2member_level1)]
- USD/CNH remains sidelined between 200-SMA and 50-SMA, portrays bullish megaphone trend-widening formation.
- Bullish MACD signals, sustained trading above 200-SMA keep offshore Chinese Yuan sellers hopeful.
- USD/CNH bears need validation from 6.8500 to retake control.
The pair currently trades last at 6.92005.
The previous day high was 6.933 while the previous day low was 6.9086. The daily 38.2% Fib levels comes at 6.9237, expected to provide resistance. Similarly, the daily 61.8% fib level is at 6.918, expected to provide support.
USD/CNH stays defensive around 6.9200 as offshore Chinese Yuan (CNH) traders seek fresh clues to extend the previous corrective bounce during early Monday.
In doing so, the USD/CNH price seesaws within an area comprising 200-SMA and 50-SMA, currently between 6.8950 and 6.9310 in that order.
It should be noted, however, that the USD/CNH pair portrays a six-week-old bullish megaphone chart pattern that suggests the quote’s further grinding towards the north. Furthermore, bullish MACD signals also keep the pair buyers hopeful.
That said, the USD/CNH pair’s upside clearance of the 50-SMA hurdle of 6.9310 can prod the stated megaphone’s top line surrounding 6.9740-50.
However, the Year-To-Date (YTD) high marked in March around 6.9970 and the 7.000 psychological magnet can challenge the USD/CNH pair’s further upside.
On the flip side, the 6.9000 round figure restricts the short-term downside of the USD/CNH pair ahead of the 200-SMA level of around 6.8950.
Following that, the stated trend-widening pattern’s lower line surrounding 6.8500 will be crucial to watch as a clear break of the same can defy the bullish formation and trigger the pair’s south-run by targeting the previous month’s low of around 6.8300.
Overall, USD/CNH remains on the bull’s radar despite the latest sluggish moves.
Trend: Further upside expected
Technical Levels: Supports and Resistances
USDCNH currently trading at 6.9194 at the time of writing. Pair opened at 6.9224 and is trading with a change of -0.04% % .
| Overview | Overview.1 | |
|---|---|---|
| 0 | Today last price | 6.9194 |
| 1 | Today Daily Change | -0.0030 |
| 2 | Today Daily Change % | -0.04% |
| 3 | Today daily open | 6.9224 |
The pair is trading above its 20 Daily moving average @ 6.9079, above its 50 Daily moving average @ 6.9021 , above its 100 Daily moving average @ 6.8745 and below its 200 Daily moving average @ 6.9579
| Trends | Trends.1 | |
|---|---|---|
| 0 | Daily SMA20 | 6.9079 |
| 1 | Daily SMA50 | 6.9021 |
| 2 | Daily SMA100 | 6.8745 |
| 3 | Daily SMA200 | 6.9579 |
The previous day high was 6.933 while the previous day low was 6.9086. The daily 38.2% Fib levels comes at 6.9237, expected to provide resistance. Similarly, the daily 61.8% fib level is at 6.918, expected to provide support.
Note the levels of interest below:
- Pivot support is noted at 6.9097, 6.897, 6.8853
- Pivot resistance is noted at 6.9341, 6.9458, 6.9585
| Levels | Levels.1 |
|---|---|
| Previous Daily High | 6.9330 |
| Previous Daily Low | 6.9086 |
| Previous Weekly High | 6.9646 |
| Previous Weekly Low | 6.8962 |
| Previous Monthly High | 6.9508 |
| Previous Monthly Low | 6.8302 |
| Daily Fibonacci 38.2% | 6.9237 |
| Daily Fibonacci 61.8% | 6.9180 |
| Daily Pivot Point S1 | 6.9097 |
| Daily Pivot Point S2 | 6.8970 |
| Daily Pivot Point S3 | 6.8853 |
| Daily Pivot Point R1 | 6.9341 |
| Daily Pivot Point R2 | 6.9458 |
| Daily Pivot Point R3 | 6.9585 |
[/s2If]
Nehcap Expert Advisor
The NEHCAP MT4 EA is high quality professional trading system geared to generate returns without using GRID or martingales. Each trade has strict risk per trade parameter. The pairs under management include EURUSD, GBPUSD, AUDCAD, AUDNZD,GBPAUD, EURAUD, EURCAD, CHFJPY and many more.
The system is trading live: LIVE ACCOUNT TRACKING
You can run it free. Apply for a free trial and track our account. Buy the system or use profit share mechanism to generate returns on your MT4.
Join Our Telegram Group


