The oil price is looking to extend its rally further above $72.00 as Fed is expected to pause rate hikes ahead. (Pivot Orderbook analysis)
…
This is a premium post.
[s2If !current_user_can(access_s2member_level4)]Please register for FREE REGISTER to read full post below containing analysis. In case of any error or you think you are not able to read the full post below, please email us at support#nehcap.com [lwa][/s2If] [s2If current_user_can(access_s2member_level1)]
- The oil price is looking to extend its rally further above $72.00 as Fed is expected to pause rate hikes ahead.
- April’s US Employment report indicated that the Fed won’t be in a hurry in hiking interest rates further in June.
- An unexpected drop in China’s factory orders could act as a headwind to the oil price.
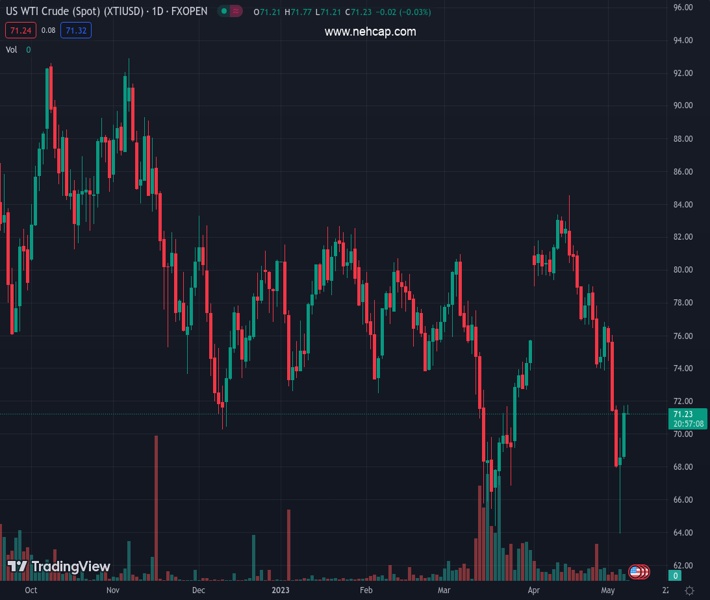
The pair currently trades last at 71.43.
The previous day high was 71.75 while the previous day low was 68.47. The daily 38.2% Fib levels comes at 70.5, expected to provide support. Similarly, the daily 61.8% fib level is at 69.72, expected to provide support.
West Texas Intermediate (WTI), futures on NYMEX, are gathering support for extending a rally above the crucial resistance of $72.00 in the early Tokyo session. The oil price has attracted bullish traction as various central banks along with the Federal Reserve (Fed) are considering an end to their policy-tightening spell to avoid further damage to their respective economies.
Investors are anticipating that no more interest rate hikes from the Fed would support producers’ confidence and would assure recovery in economic activities. The release of April’s US Employment report indicated that the Fed won’t be in a hurry in hiking interest rates further in June. The impact of higher employment additions faded after March’s job additions of 263K were downwardly revised to just 165K.
The absence of any juggernaut addition of fresh talent into the US labor market indicates that the demand for fresh labor is easing, which would soften inflationary pressures ahead. Also, the current monetary policy is sufficiently restrictive and weighs heavily on the economy.
Apart from that, the European Central Bank (ECB) slowed down their pace of interest rate hike to 25 basis points (bps) as credit disposals by European banks have dropped sharply.
Meanwhile, In China, however, factory activity contracted unexpectedly in April as orders fell and poor domestic demand dragged on the sprawling manufacturing sector, as reported by Reuters, which could act as a headwind of the oil price.
Going forward, investors will keep focus on potential US banking jitters and the meeting of US President Joe Biden with Speaker Kevin McCarthy and other congressional leaders on Tuesday’s looming debt ceiling talks. Interested parties are expected to negotiate as Republicans conveyed that an increase in the debt ceiling would come at a cost of the President’s spending initiatives when met last in February.
Technical Levels: Supports and Resistances
XTIUSD currently trading at 71.43 at the time of writing. Pair opened at 71.29 and is trading with a change of 0.2 % .
| Overview | Overview.1 | |
|---|---|---|
| 0 | Today last price | 71.43 |
| 1 | Today Daily Change | 0.14 |
| 2 | Today Daily Change % | 0.20 |
| 3 | Today daily open | 71.29 |
The pair remains strongly bearish on the daily time frame. It trades below the 20 SMA @ 77.09, 50 SMA 75.63, 100 SMA @ 76.81 and 200 SMA @ 80.99.
| Trends | Trends.1 | |
|---|---|---|
| 0 | Daily SMA20 | 77.09 |
| 1 | Daily SMA50 | 75.63 |
| 2 | Daily SMA100 | 76.81 |
| 3 | Daily SMA200 | 80.99 |
The previous day high was 71.75 while the previous day low was 68.47. The daily 38.2% Fib levels comes at 70.5, expected to provide support. Similarly, the daily 61.8% fib level is at 69.72, expected to provide support.
Note the levels of interest below:
- Pivot support is noted at 69.25, 67.22, 65.97
- Pivot resistance is noted at 72.54, 73.79, 75.82
| Levels | Levels.1 |
|---|---|
| Previous Daily High | 71.75 |
| Previous Daily Low | 68.47 |
| Previous Weekly High | 76.61 |
| Previous Weekly Low | 64.31 |
| Previous Monthly High | 83.40 |
| Previous Monthly Low | 73.88 |
| Daily Fibonacci 38.2% | 70.50 |
| Daily Fibonacci 61.8% | 69.72 |
| Daily Pivot Point S1 | 69.25 |
| Daily Pivot Point S2 | 67.22 |
| Daily Pivot Point S3 | 65.97 |
| Daily Pivot Point R1 | 72.54 |
| Daily Pivot Point R2 | 73.79 |
| Daily Pivot Point R3 | 75.82 |
[/s2If]
Nehcap Expert Advisor
The NEHCAP MT4 EA is high quality professional trading system geared to generate returns without using GRID or martingales. Each trade has strict risk per trade parameter. The pairs under management include EURUSD, GBPUSD, AUDCAD, AUDNZD,GBPAUD, EURAUD, EURCAD, CHFJPY and many more.
The system is trading live: LIVE ACCOUNT TRACKING
You can run it free. Apply for a free trial and track our account. Buy the system or use profit share mechanism to generate returns on your MT4.
Join Our Telegram Group


