#USDCAD @ 1.33730 is eyeing more weakness below 1.3370 as Canada’s upbeat job data might force the BoC to reconsider the policy pause. (Pivot Orderbook analysis)
…
This is a premium post.
[s2If !current_user_can(access_s2member_level4)]Please register for FREE REGISTER to read full post below containing analysis. In case of any error or you think you are not able to read the full post below, please email us at support#nehcap.com [lwa][/s2If] [s2If current_user_can(access_s2member_level1)]
- USD/CAD is eyeing more weakness below 1.3370 as Canada’s upbeat job data might force the BoC to reconsider the policy pause.
- Firmer oil prices and an upbeat Canada’s job market have supported the Canadian Dollar.
- US President Joe Biden is scheduled to meet Speaker Kevin McCarthy on Tuesday to talk about the looming debt ceiling crisis.
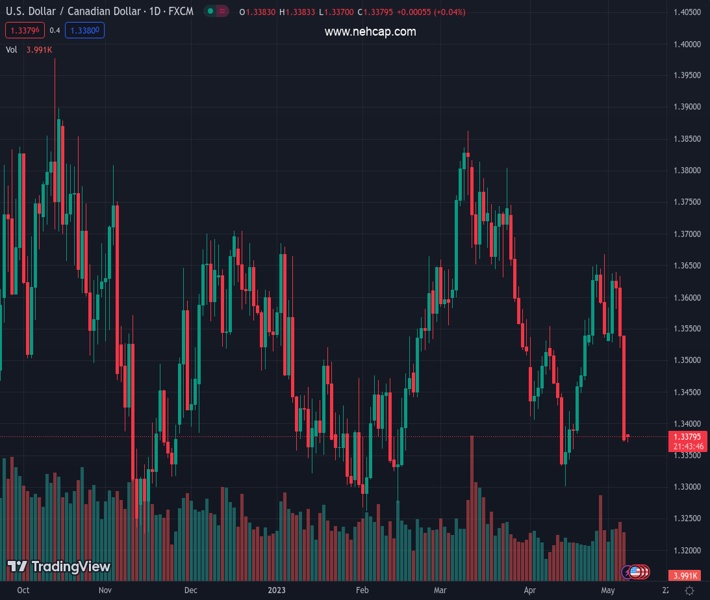
The pair currently trades last at 1.33730.
The previous day high was 1.3542 while the previous day low was 1.3371. The daily 38.2% Fib levels comes at 1.3436, expected to provide resistance. Similarly, the daily 61.8% fib level is at 1.3476, expected to provide resistance.
The USD/CAD pair has found an intermediate cushion after a massive sell-off to near 1.3370 in the early Asian session. The Loonie asset is expected to extend its downside journey as oil prices have strengthened further on expectations that the Federal Reserve (Fed) will pause its policy-tightening spell and strong Canada’s labor market data renewed fears of more interest rate hikes from the Bank of Canada (BoC).
As per Canada’s labor market report (April), Net Change in Employment landed at 41.4K vs. the estimates of 20K. The Unemployment Rate dropped to 5.0% from the expectations of 5.1%. Annual Average Hourly Earnings remained steady at 5.2%.
The US Dollar Index (DXY) has shown some recovery around 101.20 as US President Joe Biden is scheduled to meet Speaker Kevin McCarthy and other congressional leaders on Tuesday to talk about the looming debt ceiling crisis.
USD/CAD is auctioning in a Symmetrical Triangle chart pattern on a daily scale, which indicates sheer contraction in volatility followed by an expansion in the same. The downward-sloping trendline of the aforementioned chart pattern is plotted from 10 October 2022 high at 1.3978 while the upward-sloping trendline is placed from 15 November 2022 low at 1.3226.
Broadly, the 20-period Exponential Moving Average (EMA) at 1.3500 is overlapping the Loonie price, indicating a decline in volatility.
The Relative Strength Index (RSI) (14) has dropped marginally below the bearish range of 20.00-40.00 and sustenance below the same would accelerate bearish momentum.
Going forward, a breakdown below the previous week’s low at 1.3371 will drag the asset toward April 17 low at 1.3343 followed by the round-level support at 1.3300.
On the flip side, a recovery move above April 10 high at 1.3554 will drive the Loonie asset towards January 05 high at 1.3595. A breach of the latter will drive the asset toward April 26 high at 1.3651.
Technical Levels: Supports and Resistances
USDCAD currently trading at 1.338 at the time of writing. Pair opened at 1.3374 and is trading with a change of 0.04 % .
| Overview | Overview.1 | |
|---|---|---|
| 0 | Today last price | 1.3380 |
| 1 | Today Daily Change | 0.0006 |
| 2 | Today Daily Change % | 0.0400 |
| 3 | Today daily open | 1.3374 |
The pair remains strongly bearish on the daily time frame. It trades below the 20 SMA @ 1.3502, 50 SMA 1.3585, 100 SMA @ 1.3524 and 200 SMA @ 1.3446.
| Trends | Trends.1 | |
|---|---|---|
| 0 | Daily SMA20 | 1.3502 |
| 1 | Daily SMA50 | 1.3585 |
| 2 | Daily SMA100 | 1.3524 |
| 3 | Daily SMA200 | 1.3446 |
The previous day high was 1.3542 while the previous day low was 1.3371. The daily 38.2% Fib levels comes at 1.3436, expected to provide resistance. Similarly, the daily 61.8% fib level is at 1.3476, expected to provide resistance.
Note the levels of interest below:
- Pivot support is noted at 1.3317, 1.3259, 1.3146
- Pivot resistance is noted at 1.3487, 1.3599, 1.3657
| Levels | Levels.1 |
|---|---|
| Previous Daily High | 1.3542 |
| Previous Daily Low | 1.3371 |
| Previous Weekly High | 1.3639 |
| Previous Weekly Low | 1.3371 |
| Previous Monthly High | 1.3668 |
| Previous Monthly Low | 1.3301 |
| Daily Fibonacci 38.2% | 1.3436 |
| Daily Fibonacci 61.8% | 1.3476 |
| Daily Pivot Point S1 | 1.3317 |
| Daily Pivot Point S2 | 1.3259 |
| Daily Pivot Point S3 | 1.3146 |
| Daily Pivot Point R1 | 1.3487 |
| Daily Pivot Point R2 | 1.3599 |
| Daily Pivot Point R3 | 1.3657 |
[/s2If]
Nehcap Expert Advisor
The NEHCAP MT4 EA is high quality professional trading system geared to generate returns without using GRID or martingales. Each trade has strict risk per trade parameter. The pairs under management include EURUSD, GBPUSD, AUDCAD, AUDNZD,GBPAUD, EURAUD, EURCAD, CHFJPY and many more.
The system is trading live: LIVE ACCOUNT TRACKING
You can run it free. Apply for a free trial and track our account. Buy the system or use profit share mechanism to generate returns on your MT4.
Join Our Telegram Group


