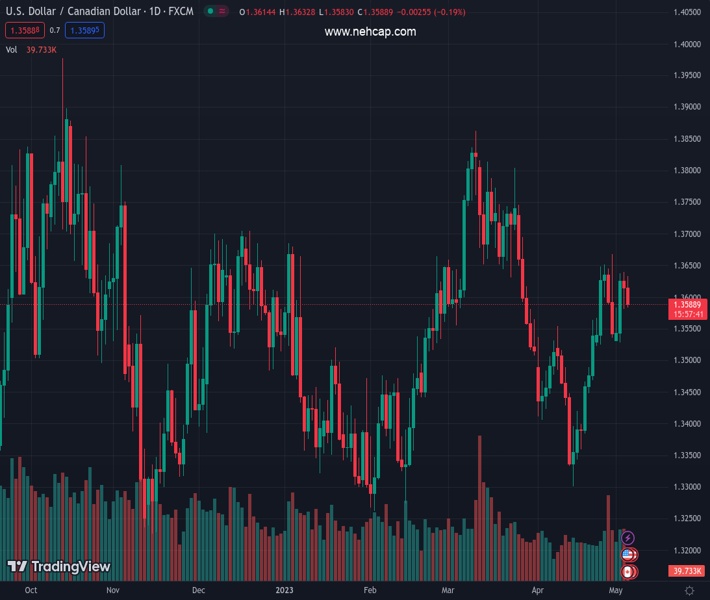
#USDCAD @ 1.35865 has slipped sharply below 1.3600 as the oil price has recovered sharply. (Pivot Orderbook analysis)
…
This is a premium post.
[s2If !current_user_can(access_s2member_level4)]Please register for FREE REGISTER to read full post below containing analysis. In case of any error or you think you are not able to read the full post below, please email us at support#nehcap.com [lwa][/s2If] [s2If current_user_can(access_s2member_level1)]
- USD/CAD has slipped sharply below 1.3600 as the oil price has recovered sharply.
- Fed Powell cited that the central bank will be more data-dependent for further action.
- Headwinds of the US debt ceiling issue and banking jitters are weighing heavily on the USD Index.
The pair currently trades last at 1.35865.
The previous day high was 1.3639 while the previous day low was 1.3582. The daily 38.2% Fib levels comes at 1.3604, expected to provide resistance. Similarly, the daily 61.8% fib level is at 1.3617, expected to provide resistance.
The USD/CAD pair has slipped below the round-level support of 1.3600 after failing to sustain above the crucial resistance of 1.3620 in the Asian session. The Loonie asset has sensed pressure amid strength in the Canadian Dollar as oil prices have strongly rebounded after refreshing the annual low of $63.60.
Earlier, oil prices witnessed a bloodbath due to soaring fears of a global economic slowdown as major central banks are tightening their monetary policy further to arrest sticky inflation. The oil was heavily sold after the Fed hiked rates by 25 basis points (bps) but managed to recover some gains as US central bank opted for a neutral stance on interest rate guidance.
It is worth noting that Canada is the leading exporter of oil to the US and a rebound in oil prices will support the Canadian Dollar.
S&P500 futures have shown some recovery in the Asian session as investors are cheering the changed language on rate guidance. Fed chair Jerome Powell cited that the central bank will be more data-dependent for further action. The updated language from ‘some hikes would be appropriate’ is acting as music to the ears of investors.
The US Dollar Index (DXY) is making efforts for defending the crucial support of 101.07 despite critical headwinds of the debt ceiling issue and banking jitters.
Going forward, the US labor market data (April) will remain in the spotlight. Considering the consensus, the US economy added 179K jobs vs. the prior addition of 236K. The jobless rate is seen unchanged at 3.5%.
On the Canadian Dollar front, investors are awaiting the release of the Canadian Employment data. The net change in Employment is seen at 20K higher than the former addition of 34.7K. The Unemployment Rate is expected to increase to 5.1%.
Technical Levels: Supports and Resistances
USDCAD currently trading at 1.3586 at the time of writing. Pair opened at 1.3615 and is trading with a change of -0.21 % .
| Overview | Overview.1 | |
|---|---|---|
| 0 | Today last price | 1.3586 |
| 1 | Today Daily Change | -0.0029 |
| 2 | Today Daily Change % | -0.2100 |
| 3 | Today daily open | 1.3615 |
The pair is trading above its 20 Daily moving average @ 1.3506, below its 50 Daily moving average @ 1.359 , above its 100 Daily moving average @ 1.3528 and above its 200 Daily moving average @ 1.344
| Trends | Trends.1 | |
|---|---|---|
| 0 | Daily SMA20 | 1.3506 |
| 1 | Daily SMA50 | 1.3590 |
| 2 | Daily SMA100 | 1.3528 |
| 3 | Daily SMA200 | 1.3440 |
The previous day high was 1.3639 while the previous day low was 1.3582. The daily 38.2% Fib levels comes at 1.3604, expected to provide resistance. Similarly, the daily 61.8% fib level is at 1.3617, expected to provide resistance.
Note the levels of interest below:
- Pivot support is noted at 1.3585, 1.3555, 1.3528
- Pivot resistance is noted at 1.3642, 1.3669, 1.3699
| Levels | Levels.1 |
|---|---|
| Previous Daily High | 1.3639 |
| Previous Daily Low | 1.3582 |
| Previous Weekly High | 1.3668 |
| Previous Weekly Low | 1.3523 |
| Previous Monthly High | 1.3668 |
| Previous Monthly Low | 1.3301 |
| Daily Fibonacci 38.2% | 1.3604 |
| Daily Fibonacci 61.8% | 1.3617 |
| Daily Pivot Point S1 | 1.3585 |
| Daily Pivot Point S2 | 1.3555 |
| Daily Pivot Point S3 | 1.3528 |
| Daily Pivot Point R1 | 1.3642 |
| Daily Pivot Point R2 | 1.3669 |
| Daily Pivot Point R3 | 1.3699 |
[/s2If]
Nehcap Expert Advisor
The NEHCAP MT4 EA is high quality professional trading system geared to generate returns without using GRID or martingales. Each trade has strict risk per trade parameter. The pairs under management include EURUSD, GBPUSD, AUDCAD, AUDNZD,GBPAUD, EURAUD, EURCAD, CHFJPY and many more.
The system is trading live: LIVE ACCOUNT TRACKING
You can run it free. Apply for a free trial and track our account. Buy the system or use profit share mechanism to generate returns on your MT4.
Join Our Telegram Group


