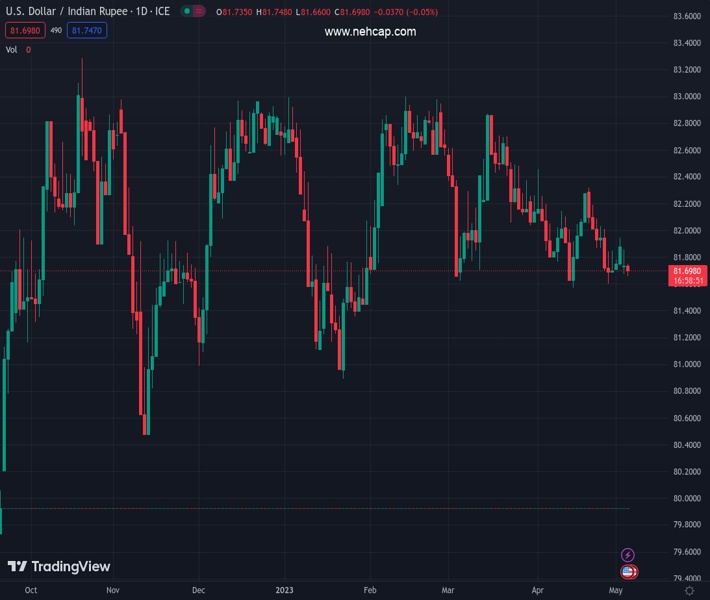
#USDINR @ 81.7175 bears prod three-week-old ascending support line, drops for the second consecutive day. (Pivot Orderbook analysis)
…
This is a premium post.
[s2If !current_user_can(access_s2member_level4)]Please register for FREE REGISTER to read full post below containing analysis. In case of any error or you think you are not able to read the full post below, please email us at support#nehcap.com [lwa][/s2If] [s2If current_user_can(access_s2member_level1)]
- USD/INR bears prod three-week-old ascending support line, drops for the second consecutive day.
- Indian Rupee buyers keep the reins amid talks of RBI’s US Dollar buying, Fed’s dovish rate hike.
- Market sentiment remains sluggish as banking crisis debt ceiling expiry woes escalate.
- Second-tier data eyed ahead of Friday’s US NFP.
The pair currently trades last at 81.7175.
The previous day high was 81.8946 while the previous day low was 81.6496. The daily 38.2% Fib levels comes at 81.7432, expected to provide resistance. Similarly, the daily 61.8% fib level is at 81.801, expected to provide resistance.
USD/INR remains on the back foot for the second consecutive day, mildly offered near 81.70 heading into Thursday’s European session. In doing so, the Indian Rupee pair benefits from the Federal Reserve’s (Fed) signals of a halt in the monetary policy tightening. However, the Reserve Bank of India’s (RBI) Open Market Operations (OMO), as well as indirect Dollar moves via Indian companies, seem to challenge the INR pair as it drills short-term key support.
Federal Reserve (Fed) announced a 25 basis points (bps) rate hike on Wednesday and propelled the benchmark rate to the highest since 2007. Following that rate announcements, Fed Chairman Jerome Powell also ruled out banking woes to praise the economic soundness. However, the omission of statements supporting further rate hikes and higher importance to the data dependency drowned the US Dollar despite the key central bank’s hawkish move.
On the other hand, downbeat Oil prices also allowed the USD/INR bears to keep the reins as the WTI benchmark dropped to the lowest levels since December 2021 before recently recovering to $69.00.
Furthermore, PacWest Bancorp teased an asset sale late Wednesday and propelled the market’s banking woes and weighed on the US Dollar, via indirect challenges to further rate hikes. Additionally, the White House statements suggesting debt limit default could cost 8.3 million job losses also weigh on the sentiment and the US Dollar.
On the same line could be the heavy inflow of funds into Indian equities. “Foreigners are buyers of $1.5 billion of Indian equities in the last three sessions,” per Reuters. Also, a 13-year high of India’s S&P Global Services PMI for April exerts downside pressure on the USD/INR price.
It’s worth mentioning that Reuters quote anonymous traders to state that the RBI has been buying dollars via public sector banks to keep the pair narrow range, which in turn should prod the USD/INR bears. On the same line could be the recent rebound in the Oil price.
Moving on, USD/INR traders should pay attention to the risk catalysts and second-tier US data ahead of Friday’s key US Nonfarm Payrolls (NFP) for clear directions.
A three-week-old ascending support line joins the 200-DMA to restrict the short-term USD/INR downside near 81.65-60. That said, recovery moves need validation from the 21-DMA hurdle of around 81.90.
Technical Levels: Supports and Resistances
USDINR currently trading at 81.7004 at the time of writing. Pair opened at 81.7766 and is trading with a change of -0.09% % .
| Overview | Overview.1 | |
|---|---|---|
| 0 | Today last price | 81.7004 |
| 1 | Today Daily Change | -0.0762 |
| 2 | Today Daily Change % | -0.09% |
| 3 | Today daily open | 81.7766 |
The pair is trading below its 20 Daily moving average @ 81.9124, below its 50 Daily moving average @ 82.1493 , below its 100 Daily moving average @ 82.21 and above its 200 Daily moving average @ 81.6031
| Trends | Trends.1 | |
|---|---|---|
| 0 | Daily SMA20 | 81.9124 |
| 1 | Daily SMA50 | 82.1493 |
| 2 | Daily SMA100 | 82.2100 |
| 3 | Daily SMA200 | 81.6031 |
The previous day high was 81.8946 while the previous day low was 81.6496. The daily 38.2% Fib levels comes at 81.7432, expected to provide resistance. Similarly, the daily 61.8% fib level is at 81.801, expected to provide resistance.
Note the levels of interest below:
- Pivot support is noted at 81.6526, 81.5286, 81.4076
- Pivot resistance is noted at 81.8975, 82.0185, 82.1425
| Levels | Levels.1 |
|---|---|
| Previous Daily High | 81.8946 |
| Previous Daily Low | 81.6496 |
| Previous Weekly High | 82.1614 |
| Previous Weekly Low | 81.4850 |
| Previous Monthly High | 82.5092 |
| Previous Monthly Low | 81.4850 |
| Daily Fibonacci 38.2% | 81.7432 |
| Daily Fibonacci 61.8% | 81.8010 |
| Daily Pivot Point S1 | 81.6526 |
| Daily Pivot Point S2 | 81.5286 |
| Daily Pivot Point S3 | 81.4076 |
| Daily Pivot Point R1 | 81.8975 |
| Daily Pivot Point R2 | 82.0185 |
| Daily Pivot Point R3 | 82.1425 |
[/s2If]
Nehcap Expert Advisor
The NEHCAP MT4 EA is high quality professional trading system geared to generate returns without using GRID or martingales. Each trade has strict risk per trade parameter. The pairs under management include EURUSD, GBPUSD, AUDCAD, AUDNZD,GBPAUD, EURAUD, EURCAD, CHFJPY and many more.
The system is trading live: LIVE ACCOUNT TRACKING
You can run it free. Apply for a free trial and track our account. Buy the system or use profit share mechanism to generate returns on your MT4.
Join Our Telegram Group


