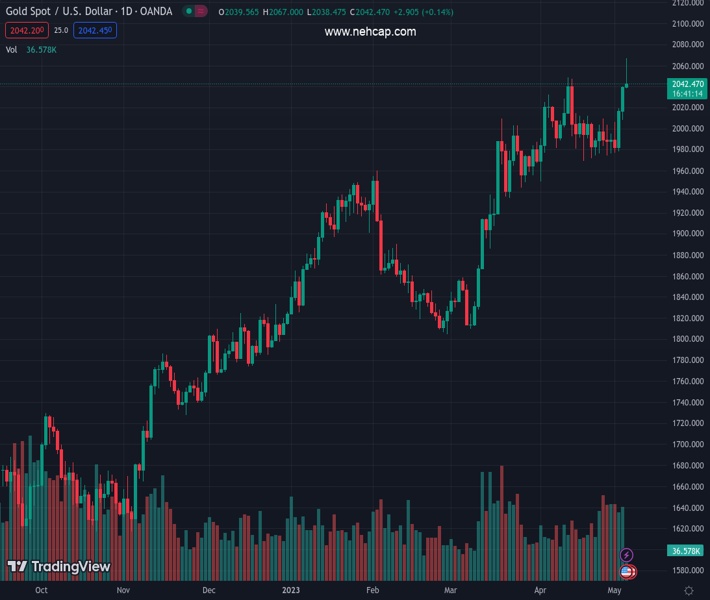
#XAUUSD @ 2,042.39 Gold price has corrected to near $2,040.00 after printing a fresh all-time high at $2,079.76. (Pivot Orderbook analysis)
…
This is a premium post.
[s2If !current_user_can(access_s2member_level4)]Please register for FREE REGISTER to read full post below containing analysis. In case of any error or you think you are not able to read the full post below, please email us at support#nehcap.com [lwa][/s2If] [s2If current_user_can(access_s2member_level1)]
- Gold price has corrected to near $2,040.00 after printing a fresh all-time high at $2,079.76.
- The USD Index is holding losses amid various headwinds such as renewed US banking crisis and debt ceiling issues.
- US President Joe Biden is not interested in raising the debt ceiling at the cost of the President’s spending initiatives.
The pair currently trades last at 2042.39.
The previous day high was 2040.47 while the previous day low was 2007.79. The daily 38.2% Fib levels comes at 2027.99, expected to provide support. Similarly, the daily 61.8% fib level is at 2020.27, expected to provide support.
Gold price has retreated sharply to near $2,040.00 in the Asian session after printing all-time highs of $2,079.76. The precious metal has corrected swiftly as profit-booking kicked in after solid gains inspired by changed language on interest rate guidance from the Federal Reserve (Fed) after hiking critical rates by consecutive 25 basis points (bps) to 5.00-5.25%.
The USD Index is making efforts to defend its immediate support of 101.07, however, the downside seems favored due to various headwinds. US banking jitters have renewed as Bloomberg reported that PacWest Bancorp is considering strategic options, including a potential sale.
While fears of debt ceiling issues are accelerating as US President Joe Biden is not interested in raising the debt ceiling in negotiations with Republicans at the cost of the President’s spending initiatives.
Meanwhile, S&P500 futures have shown some recovery indicating a recovery in the risk-off market mood. Accelerating fears of the US debt ceiling have weighed heavily on Treasury yields. The yields offered on 10-year US government bonds have dropped to near 3.33%.
Going forward, US labor market data will be keenly watched. As per the expectations, the US Nonfarm Payrolls (NFP) data is seen at 179K lower than the former release of 236K. The Unemployment Rate is seen steady at 3.5%. Also, Average Hourly Earnings are seen as stable. Consistent labor cost index data could force the Fed to re-consider a pause in the rate-hiking spell as it could fuel inflationary pressures.
Gold price has corrected to near $2,040.00 after printing a fresh all-time high at $2,079.76. The precious metal has covered the gap made after the Fed policy on an intraday chart, which is acting as a cushion. Also, the 50-period Exponential Moving Average (EMA) at $2,038.56 is providing support to the Gold bulls. A recovery move above the 20-period EMA would support Gold bulls in reclaiming all-time highs.
The Relative Strength Index (RSI) (14) gauged support around 40.00 and is looking for a recovery.
Technical Levels: Supports and Resistances
XAUUSD currently trading at 2041.02 at the time of writing. Pair opened at 2038.92 and is trading with a change of 0.1 % .
| Overview | Overview.1 | |
|---|---|---|
| 0 | Today last price | 2041.02 |
| 1 | Today Daily Change | 2.10 |
| 2 | Today Daily Change % | 0.10 |
| 3 | Today daily open | 2038.92 |
The pair remains strongly bullish on the daily timeframe. It trades above its 20 SMA @ 2002.88, 50 SMA 1944.39, 100 SMA @ 1904.04 and 200 SMA @ 1811.78.
| Trends | Trends.1 | |
|---|---|---|
| 0 | Daily SMA20 | 2002.88 |
| 1 | Daily SMA50 | 1944.39 |
| 2 | Daily SMA100 | 1904.04 |
| 3 | Daily SMA200 | 1811.78 |
The previous day high was 2040.47 while the previous day low was 2007.79. The daily 38.2% Fib levels comes at 2027.99, expected to provide support. Similarly, the daily 61.8% fib level is at 2020.27, expected to provide support.
Note the levels of interest below:
- Pivot support is noted at 2017.65, 1996.38, 1984.97
- Pivot resistance is noted at 2050.33, 2061.74, 2083.01
| Levels | Levels.1 |
|---|---|
| Previous Daily High | 2040.47 |
| Previous Daily Low | 2007.79 |
| Previous Weekly High | 2009.41 |
| Previous Weekly Low | 1974.13 |
| Previous Monthly High | 2048.75 |
| Previous Monthly Low | 1949.83 |
| Daily Fibonacci 38.2% | 2027.99 |
| Daily Fibonacci 61.8% | 2020.27 |
| Daily Pivot Point S1 | 2017.65 |
| Daily Pivot Point S2 | 1996.38 |
| Daily Pivot Point S3 | 1984.97 |
| Daily Pivot Point R1 | 2050.33 |
| Daily Pivot Point R2 | 2061.74 |
| Daily Pivot Point R3 | 2083.01 |
[/s2If]
Nehcap Expert Advisor
The NEHCAP MT4 EA is high quality professional trading system geared to generate returns without using GRID or martingales. Each trade has strict risk per trade parameter. The pairs under management include EURUSD, GBPUSD, AUDCAD, AUDNZD,GBPAUD, EURAUD, EURCAD, CHFJPY and many more.
The system is trading live: LIVE ACCOUNT TRACKING
You can run it free. Apply for a free trial and track our account. Buy the system or use profit share mechanism to generate returns on your MT4.
Join Our Telegram Group


