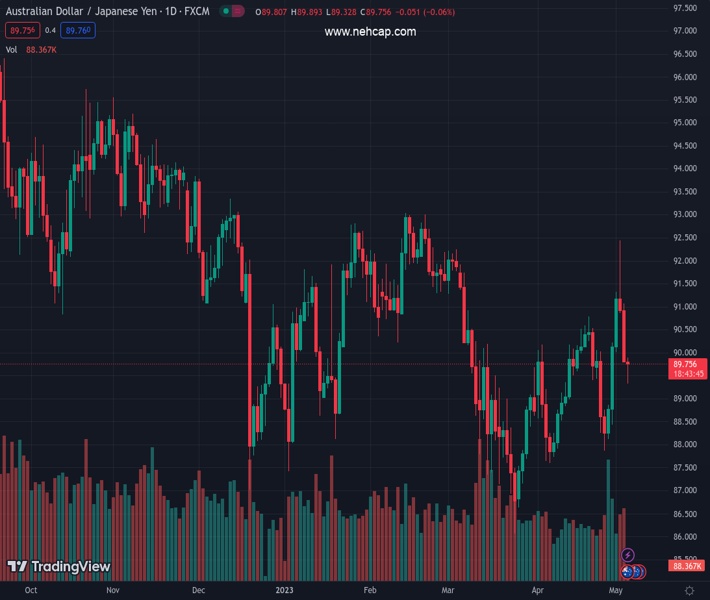
#AUDJPY @ 89.7530 recovers from weekly low, pares intraday losses during three-day downtrend., @nehcap view: Pullback expected (Pivot Orderbook analysis)
…
This is a premium post.
[s2If !current_user_can(access_s2member_level4)]Please register for FREE REGISTER to read full post below containing analysis. In case of any error or you think you are not able to read the full post below, please email us at support#nehcap.com [lwa][/s2If] [s2If current_user_can(access_s2member_level1)]
- AUD/JPY recovers from weekly low, pares intraday losses during three-day downtrend.
- 50% Fibonacci retracement level, nearly oversold RSI challenges further downside.
- Australia trade numbers for March came in firmer, China Caixin Manufacturing PMI for April disappoints.
- Convergence of 50-SMA, 100-SMA and one-week-old previous support line guards immediate upside.
The pair currently trades last at 89.7530.
The previous day high was 91.07 while the previous day low was 89.85. The daily 38.2% Fib levels comes at 90.31, expected to provide resistance. Similarly, the daily 61.8% fib level is at 90.6, expected to provide resistance.
AUD/JPY picks up bids to pare intraday gains around the weekly low as traders cheer strong Aussie foreign trade numbers while paying little heed to China activity data on early Thursday. In doing so, the cross-currency pair prints mild losses near 89.80 during a three-day losing streak.
That said, China’s Caixin Manufacturing PMI for April drops to 49.5 versus 50.3 expected and 50.0 prior. Earlier in the week, the NBS Manufacturing PMI for the dragon nation offered a negative surprise before the Chinese markets went on a long holiday until Thursday.
On the other hand, Australia’s headline Trade Balance rose to 15,269M in April versus 12,650M market forecast and 13,870 prior. Further, Exports and Imports also improved to 4.0% and 2.0% versus -3.0% and -9.0% respective priors.
As a result, the Aussie data helps the AUD/JPY price to rebound from a 50% Fibonacci retracement of the pair’s run-up from late March to early May, backed by nearly oversold RSI (14).
However, downbeat China PMI data and convergence of the 100-SMA and 50-SMA join the bearish MACD signals to challenge the pair buyers near 89.75-85 resistance confluence.
Even if the quote rises past 89.85 hurdle, the 90.00 round figure and April 20 swing high of near 90.80 can restrict the AUD/JPY pair’s further advances.
Meanwhile, 50% and 61.8% Fibonacci retracements can limit the short-term downside of the AUD/JPY pair near 89.30 and 88.50 levels in that order.
Following that, an upward-sloping support line from early April, near the 88.00 threshold, will be crucial to watch for the pair sellers.
Trend: Pullback expected
Technical Levels: Supports and Resistances
AUDJPY currently trading at 89.78 at the time of writing. Pair opened at 89.85 and is trading with a change of -0.08% % .
| Overview | Overview.1 | |
|---|---|---|
| 0 | Today last price | 89.78 |
| 1 | Today Daily Change | -0.07 |
| 2 | Today Daily Change % | -0.08% |
| 3 | Today daily open | 89.85 |
The pair is trading above its 20 Daily moving average @ 89.56, above its 50 Daily moving average @ 89.53 , below its 100 Daily moving average @ 90.18 and below its 200 Daily moving average @ 92.13
| Trends | Trends.1 | |
|---|---|---|
| 0 | Daily SMA20 | 89.56 |
| 1 | Daily SMA50 | 89.53 |
| 2 | Daily SMA100 | 90.18 |
| 3 | Daily SMA200 | 92.13 |
The previous day high was 91.07 while the previous day low was 89.85. The daily 38.2% Fib levels comes at 90.31, expected to provide resistance. Similarly, the daily 61.8% fib level is at 90.6, expected to provide resistance.
Note the levels of interest below:
- Pivot support is noted at 89.44, 89.03, 88.22
- Pivot resistance is noted at 90.66, 91.47, 91.88
| Levels | Levels.1 |
|---|---|
| Previous Daily High | 91.07 |
| Previous Daily Low | 89.85 |
| Previous Weekly High | 90.22 |
| Previous Weekly Low | 87.87 |
| Previous Monthly High | 90.78 |
| Previous Monthly Low | 87.59 |
| Daily Fibonacci 38.2% | 90.31 |
| Daily Fibonacci 61.8% | 90.60 |
| Daily Pivot Point S1 | 89.44 |
| Daily Pivot Point S2 | 89.03 |
| Daily Pivot Point S3 | 88.22 |
| Daily Pivot Point R1 | 90.66 |
| Daily Pivot Point R2 | 91.47 |
| Daily Pivot Point R3 | 91.88 |
[/s2If]
Nehcap Expert Advisor
The NEHCAP MT4 EA is high quality professional trading system geared to generate returns without using GRID or martingales. Each trade has strict risk per trade parameter. The pairs under management include EURUSD, GBPUSD, AUDCAD, AUDNZD,GBPAUD, EURAUD, EURCAD, CHFJPY and many more.
The system is trading live: LIVE ACCOUNT TRACKING
You can run it free. Apply for a free trial and track our account. Buy the system or use profit share mechanism to generate returns on your MT4.
Join Our Telegram Group


