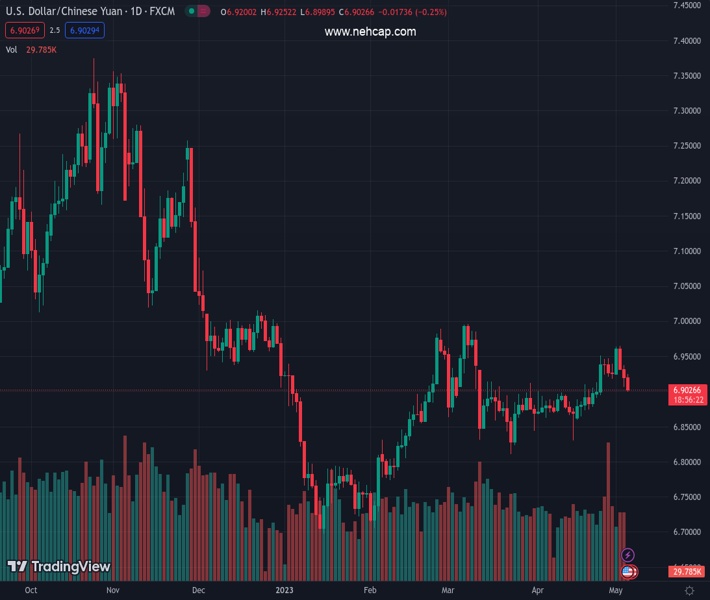
#USDCNH @ 6.90506 remains sidelined after refreshing intraday low, drops to one-week low during three-day downtrend. (Pivot Orderbook analysis)
…
This is a premium post.
[s2If !current_user_can(access_s2member_level4)]Please register for FREE REGISTER to read full post below containing analysis. In case of any error or you think you are not able to read the full post below, please email us at support#nehcap.com [lwa][/s2If] [s2If current_user_can(access_s2member_level1)]
- USD/CNH remains sidelined after refreshing intraday low, drops to one-week low during three-day downtrend.
- China Caixin Manufacturing PMI drops to 49.5 versus 50.3 expected and 50.0 prior.
- Fed fails to impress hawks despite marching market forecasts of 0.25% rate hike.
- US NFP, risk catalysts eyed for clear directions.
The pair currently trades last at 6.90506.
The previous day high was 6.9372 while the previous day low was 6.9064. The daily 38.2% Fib levels comes at 6.9182, expected to provide resistance. Similarly, the daily 61.8% fib level is at 6.9255, expected to provide resistance.
USD/CNH prods a three-day downtrend as it seesaws around 6.9000, refreshing the weekly low near 6.8992 at the latest, after witnessing a negative surprise from China activity data on early Thursday. It’s worth noting that the Federal Reserve’s (Fed) dovish hike favors the offshore Chinese Yuan (CNH) pair bears as traders return after a long weekend.
China’s Caixin Manufacturing PMI for April drops to 49.5 versus 50.3 expected and 50.0 prior. Earlier in the week, the NBS Manufacturing PMI for the dragon nation offered a negative surprise before the Chinese markets went on a long holiday until Thursday.
Even so, the US Federal Reserve’s (Fed) failure to convince the US Dollar buyers despite increasing the benchmark rates to the highest levels since 2007 seems to keep the USD/CNH bears hopeful. That said, Fed Chairman Jerome Powell also appeared positive while ruling out fears of a banking rout. However, a dropping of the lines in the statement suggesting the need for further rate hikes gained major attention and weighed on the US Dollar despite the hawkish move by the Fed.
Not only the Fed but the US data were also impressive but couldn’t please the greenback of late. On Thursday, US ADP Employment Change rose to 296K for April from 142K prior versus 148K market forecast. Additionally, the annual pay growth declined to 13.2% from 14.2%. Further, ISM Services PMI improved to 51.9 in April versus 51.8 market forecasts and 51.2 previous readings. It’s worth noting, however, that the S&P Global Services PMI and Composite PMI for April eased to 53.6 and 53.4 versus 53.7 and 53.5 respective priors.
It’s worth mentioning, however, that the greenback’s weakness could be linked to the growing banking turmoil in the United States and looming fears of the debt ceiling expiration. Recently, PacWest Bancorp teased an asset sale and propelled the market’s banking woes while the White House statements suggesting debt limit default could cost 8.3 million job losses weigh on the sentiment.
Amid these plays, S&P 500 Futures print mild losses by tracking the Wall Street benchmarks. It should be observed that holidays in Japan restrict bond market moves in Asia.
Having witnessed the initial reaction to the Fed moves and China data, USD/CNH pair traders should pay attention to the risk catalysts as the latest risk-off mood seem to put a floor under the US Dollar. Additionally important will be the second-tier US data ahead of Friday’s NFP.
A convergence of the 21-DMA and 50-DMA, near 6.9040-30, restricts the immediate downside of the USD/CNH pair. It’s worth noting, however, that the downbeat oscillators keep favoring the sellers.
Technical Levels: Supports and Resistances
USDCNH currently trading at 6.9002 at the time of writing. Pair opened at 6.922 and is trading with a change of -0.31% % .
| Overview | Overview.1 | |
|---|---|---|
| 0 | Today last price | 6.9002 |
| 1 | Today Daily Change | -0.0218 |
| 2 | Today Daily Change % | -0.31% |
| 3 | Today daily open | 6.922 |
The pair is trading below its 20 Daily moving average @ 6.9039, below its 50 Daily moving average @ 6.9032 , above its 100 Daily moving average @ 6.8759 and below its 200 Daily moving average @ 6.9562
| Trends | Trends.1 | |
|---|---|---|
| 0 | Daily SMA20 | 6.9039 |
| 1 | Daily SMA50 | 6.9032 |
| 2 | Daily SMA100 | 6.8759 |
| 3 | Daily SMA200 | 6.9562 |
The previous day high was 6.9372 while the previous day low was 6.9064. The daily 38.2% Fib levels comes at 6.9182, expected to provide resistance. Similarly, the daily 61.8% fib level is at 6.9255, expected to provide resistance.
Note the levels of interest below:
- Pivot support is noted at 6.9066, 6.8911, 6.8758
- Pivot resistance is noted at 6.9374, 6.9527, 6.9682
| Levels | Levels.1 |
|---|---|
| Previous Daily High | 6.9372 |
| Previous Daily Low | 6.9064 |
| Previous Weekly High | 6.9508 |
| Previous Weekly Low | 6.8910 |
| Previous Monthly High | 6.9508 |
| Previous Monthly Low | 6.8302 |
| Daily Fibonacci 38.2% | 6.9182 |
| Daily Fibonacci 61.8% | 6.9255 |
| Daily Pivot Point S1 | 6.9066 |
| Daily Pivot Point S2 | 6.8911 |
| Daily Pivot Point S3 | 6.8758 |
| Daily Pivot Point R1 | 6.9374 |
| Daily Pivot Point R2 | 6.9527 |
| Daily Pivot Point R3 | 6.9682 |
[/s2If]
Nehcap Expert Advisor
The NEHCAP MT4 EA is high quality professional trading system geared to generate returns without using GRID or martingales. Each trade has strict risk per trade parameter. The pairs under management include EURUSD, GBPUSD, AUDCAD, AUDNZD,GBPAUD, EURAUD, EURCAD, CHFJPY and many more.
The system is trading live: LIVE ACCOUNT TRACKING
You can run it free. Apply for a free trial and track our account. Buy the system or use profit share mechanism to generate returns on your MT4.
Join Our Telegram Group


