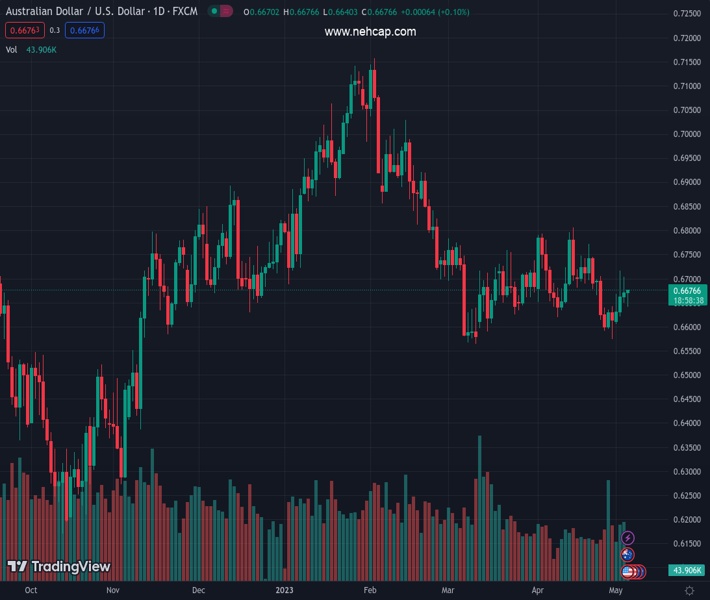
#AUDUSD @ 0.66716 has soared above 0.6670 on solid Trade Balance data. (Pivot Orderbook analysis)
…
This is a premium post.
[s2If !current_user_can(access_s2member_level4)]Please register for FREE REGISTER to read full post below containing analysis. In case of any error or you think you are not able to read the full post below, please email us at support#nehcap.com [lwa][/s2If] [s2If current_user_can(access_s2member_level1)]
- AUD/USD has soared above 0.6670 on solid Trade Balance data.
- Caixin Manufacturing PMI
- has
- landed lower at 49.5 vs. the estimates of 50.3 and the former release of 50.
- The USD index might slip further below 101.00 amid rising concerns over the US debt ceiling issue and banking jitters.
The pair currently trades last at 0.66716.
The previous day high was 0.6703 while the previous day low was 0.6649. The daily 38.2% Fib levels comes at 0.6683, expected to provide resistance. Similarly, the daily 61.8% fib level is at 0.667, expected to provide support.
The AUD/USD pair has climbed swiftly above 0.6670 on upbeat Australian Trade Balance data. The Australian Bureau of Statistics has reported upbeat Trade Balance data. The economic data has jumped to 15,269M, higher than the estimates of 12,650M and the former release of 13,870M.
Meanwhile, the Caixin Manufacturing PMI (April) data have missed estimates. The economic data has landed at 49.5, lower than the estimates of 50.3 and the former release of 50.0. Despite fiscal and monetary support the Chinese economy is struggling to remain on track of progress.
It is worth noting that Australia is the leading trading partner of China and weak Chinese manufacturing PMI would impact the Australian Dollar.
On Wednesday, the Australian Dollar didn’t show a meaningful action despite the release of upbeat Retails Sales data. Australian agency reported an acceleration in retail demand by 0.4%, the slowest annual pace due to higher interest rates from the Reserve Bank of Australia (RBA), as reported by Reuters. Households have trimmed spending on core goods led by the mounting burden of interest obligations fur to higher borrowing costs.
Earlier this week, RBA Governor Philip Lower unexpectedly hiked interest rates by 25 basis points (bps) to 3.85% while the street was expecting a continuation of a neutral policy. The RBA hiked its Official Cash Rate (OCR) despite the consistent softening of Australian inflation.
The US Dollar Index (DXY) has retreated after a poor recovery attempt to near 101.20. The USD index is expected to slip further below the crucial support of 101.00 amid rising concerns over US debt ceiling issue and banking jitters.
The White House has reported that a default on U.S. payment obligations due to the failure of the debt ceiling raise on time could result in the loss of 8.3 million jobs and a 6.1% reduction in economic output, as reported by Reuters.
Technical Levels: Supports and Resistances
AUDUSD currently trading at 0.6674 at the time of writing. Pair opened at 0.667 and is trading with a change of 0.06 % .
| Overview | Overview.1 | |
|---|---|---|
| 0 | Today last price | 0.6674 |
| 1 | Today Daily Change | 0.0004 |
| 2 | Today Daily Change % | 0.0600 |
| 3 | Today daily open | 0.6670 |
The pair remains strongly bearish on the daily time frame. It trades below the 20 SMA @ 0.6676, 50 SMA 0.6686, 100 SMA @ 0.6788 and 200 SMA @ 0.6732.
| Trends | Trends.1 | |
|---|---|---|
| 0 | Daily SMA20 | 0.6676 |
| 1 | Daily SMA50 | 0.6686 |
| 2 | Daily SMA100 | 0.6788 |
| 3 | Daily SMA200 | 0.6732 |
The previous day high was 0.6703 while the previous day low was 0.6649. The daily 38.2% Fib levels comes at 0.6683, expected to provide resistance. Similarly, the daily 61.8% fib level is at 0.667, expected to provide support.
Note the levels of interest below:
- Pivot support is noted at 0.6645, 0.662, 0.6591
- Pivot resistance is noted at 0.6699, 0.6728, 0.6753
| Levels | Levels.1 |
|---|---|
| Previous Daily High | 0.6703 |
| Previous Daily Low | 0.6649 |
| Previous Weekly High | 0.6706 |
| Previous Weekly Low | 0.6574 |
| Previous Monthly High | 0.6806 |
| Previous Monthly Low | 0.6574 |
| Daily Fibonacci 38.2% | 0.6683 |
| Daily Fibonacci 61.8% | 0.6670 |
| Daily Pivot Point S1 | 0.6645 |
| Daily Pivot Point S2 | 0.6620 |
| Daily Pivot Point S3 | 0.6591 |
| Daily Pivot Point R1 | 0.6699 |
| Daily Pivot Point R2 | 0.6728 |
| Daily Pivot Point R3 | 0.6753 |
[/s2If]
Nehcap Expert Advisor
The NEHCAP MT4 EA is high quality professional trading system geared to generate returns without using GRID or martingales. Each trade has strict risk per trade parameter. The pairs under management include EURUSD, GBPUSD, AUDCAD, AUDNZD,GBPAUD, EURAUD, EURCAD, CHFJPY and many more.
The system is trading live: LIVE ACCOUNT TRACKING
You can run it free. Apply for a free trial and track our account. Buy the system or use profit share mechanism to generate returns on your MT4.
Join Our Telegram Group


