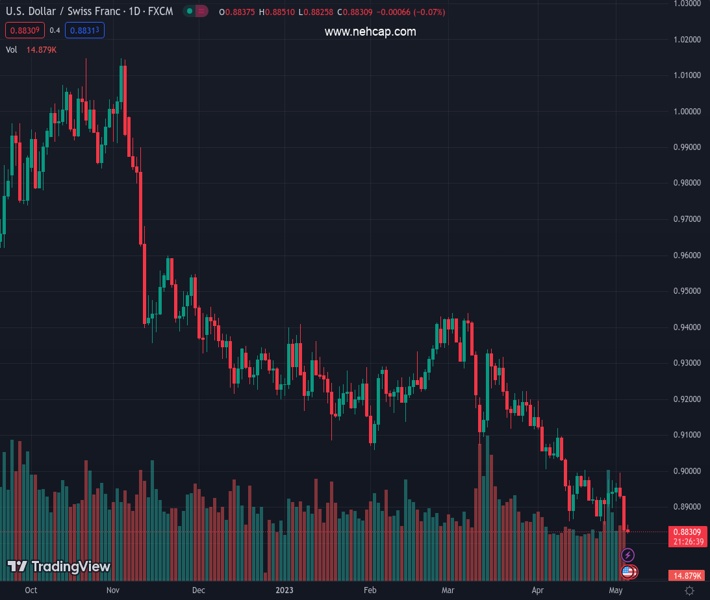
#USDCHF @ 0.88319 remains pressured at the lowest levels since January 2021 after falling the most in seven weeks. (Pivot Orderbook analysis)
…
This is a premium post.
[s2If !current_user_can(access_s2member_level4)]Please register for FREE REGISTER to read full post below containing analysis. In case of any error or you think you are not able to read the full post below, please email us at support#nehcap.com [lwa][/s2If] [s2If current_user_can(access_s2member_level1)]
- USD/CHF remains pressured at the lowest levels since January 2021 after falling the most in seven weeks.
- Fed announces a dovish rate hike of 0.25%, dumping statement on interest rate lifts gain major attention.
- Bank fallouts, US debt ceiling expiration also weigh on sentiment and Swiss Franc pair.
- Risk catalysts are the key for immediate directions.
The pair currently trades last at 0.88319.
The previous day high was 0.8995 while the previous day low was 0.8924. The daily 38.2% Fib levels comes at 0.8951, expected to provide resistance. Similarly, the daily 61.8% fib level is at 0.8968, expected to provide resistance.
USD/CHF holds lower grounds near 0.8830 amid early Thursday, after falling to early 2021 levels on the Federal Reserve’s (Fed) dovish rate hike. The risk-barometer pair also bears the burden of the market’s fears of US default and banking fallouts. With this, the Swiss Franc (CHF) pair prints a three-day downtrend near the multi-month low following the biggest daily slump in nearly seven weeks.
Fed lifted its benchmark rate to the highest levels since 2007 by announcing a 0.25% increase, matching market forecasts. The policymakers including Chairman Jerome Powell appeared positive while ruling out fears of banking rout. However, a dropping in the statement suggesting the need for further rate hikes gained major attention and weighed on the US Dollar despite the hawkish move.
On the other hand, PacWest Bancorp recently became another US bank to witness the heat of excess withdrawal and is on the brink of collapse. That said, Western Alliance Bancorp is also in the line and hence the US banking sector appears in trouble moving forward, which in turn weighs on the market sentiment and prods the hawkish central banks, as it did to the Fed.
Elsewhere, the comments from the White House suggesting debt limit default could cost 8.3 million job losses also weigh n the sentiment and the USD/CHF pair.
Talking about the data, US ADP Employment Change rose to 296K for April from 142K prior versus 148K market forecast. Additionally, the annual pay growth declined to 13.2% from 14.2%. Further, ISM Services PMI improved to 51.9 in April versus 51.8 market forecasts and 51.2 previous readings. It’s worth noting, however, that the S&P Global Services PMI and Composite PMI for April eased to 53.6 and 53.4 versus 53.7 and 53.5 respective priors.
Amid these plays, Wall Street closed with minor losses and the yields remain pressured while weighing on the US Dollar Index.
Moving on, market players may pay close attention to the risk catalysts for fresh impulse amid a dearth of top-tier data. However, European Central Bank (ECB) Monetary Policy Meeting can entertain traders.
A clear downside break of a three-week-old descending support line, now immediate resistance near 0.8850, directs USD/CHF bears towards the year 2021 low of around 0.8755.
Technical Levels: Supports and Resistances
USDCHF currently trading at 0.8829 at the time of writing. Pair opened at 0.8932 and is trading with a change of -1.15% % .
| Overview | Overview.1 | |
|---|---|---|
| 0 | Today last price | 0.8829 |
| 1 | Today Daily Change | -0.0103 |
| 2 | Today Daily Change % | -1.15% |
| 3 | Today daily open | 0.8932 |
The pair remains strongly bearish on the daily time frame. It trades below the 20 SMA @ 0.8967, 50 SMA 0.9145, 100 SMA @ 0.9196 and 200 SMA @ 0.9441.
| Trends | Trends.1 | |
|---|---|---|
| 0 | Daily SMA20 | 0.8967 |
| 1 | Daily SMA50 | 0.9145 |
| 2 | Daily SMA100 | 0.9196 |
| 3 | Daily SMA200 | 0.9441 |
The previous day high was 0.8995 while the previous day low was 0.8924. The daily 38.2% Fib levels comes at 0.8951, expected to provide resistance. Similarly, the daily 61.8% fib level is at 0.8968, expected to provide resistance.
Note the levels of interest below:
- Pivot support is noted at 0.8905, 0.8879, 0.8834
- Pivot resistance is noted at 0.8977, 0.9021, 0.9048
| Levels | Levels.1 |
|---|---|
| Previous Daily High | 0.8995 |
| Previous Daily Low | 0.8924 |
| Previous Weekly High | 0.8976 |
| Previous Weekly Low | 0.8852 |
| Previous Monthly High | 0.9198 |
| Previous Monthly Low | 0.8852 |
| Daily Fibonacci 38.2% | 0.8951 |
| Daily Fibonacci 61.8% | 0.8968 |
| Daily Pivot Point S1 | 0.8905 |
| Daily Pivot Point S2 | 0.8879 |
| Daily Pivot Point S3 | 0.8834 |
| Daily Pivot Point R1 | 0.8977 |
| Daily Pivot Point R2 | 0.9021 |
| Daily Pivot Point R3 | 0.9048 |
[/s2If]
Nehcap Expert Advisor
The NEHCAP MT4 EA is high quality professional trading system geared to generate returns without using GRID or martingales. Each trade has strict risk per trade parameter. The pairs under management include EURUSD, GBPUSD, AUDCAD, AUDNZD,GBPAUD, EURAUD, EURCAD, CHFJPY and many more.
The system is trading live: LIVE ACCOUNT TRACKING
You can run it free. Apply for a free trial and track our account. Buy the system or use profit share mechanism to generate returns on your MT4.
Join Our Telegram Group


