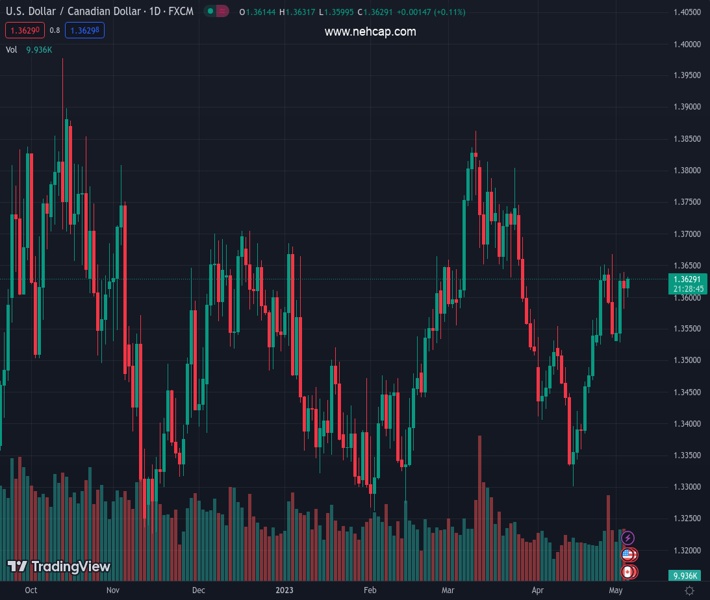
#USDCAD @ 1.36283 is preparing for further side as oil prices continue to bleed amid fears of a global economic slowdown. (Pivot Orderbook analysis)
…
This is a premium post.
[s2If !current_user_can(access_s2member_level4)]Please register for FREE REGISTER to read full post below containing analysis. In case of any error or you think you are not able to read the full post below, please email us at support#nehcap.com [lwa][/s2If] [s2If current_user_can(access_s2member_level1)]
- USD/CAD is preparing for further side as oil prices continue to bleed amid fears of a global economic slowdown.
- Later this week, US/Canada Employment data will be keenly watched.
- USD/CAD is approaching the 61.8% Fibonacci retracement plotted at 1.3648.
The pair currently trades last at 1.36283.
The previous day high was 1.3638 while the previous day low was 1.3529. The daily 38.2% Fib levels comes at 1.3596, expected to provide support. Similarly, the daily 61.8% fib level is at 1.357, expected to provide support.
The USD/CAD pair has turned sideways after a perpendicular rally to near 1.3630 in the early Asian session. The Loonie asset is gathering strength for further upside as a bloodbath in oil prices amid deepening fears of a global economic slowdown due to higher interest rates from central banks. The street is worried about the oil demand outlook as tight liquidity conditions would force firms to underutilize their production capacities.
Oil prices have refreshed their annual low of $63.60 after the Federal Reserve (Fed) hikes interest rates by 25 basis points (bps) to 5.00-5.25%.
Going forward, the Canadian Dollar will dance to the tunes of Friday’s Employment data (April). The net change in Employment is seen at 20K higher than the former addition of 34.7K. The Unemployment Rate is expected to increase to 5.1%.
Also, the US Employment data (April) will be keenly watched. The US Nonfarm Payrolls (NFP) data is seen at 179K lower than the former release of 236K.
USD/CAD is approaching the 61.8% Fibonacci retracement (placed from March 10 high at 1.3862 to April 14 low at 1.3301) at 1.3648. The downward-sloping trendline from March 10 high at 1.3862 has acted as a major barricade for the US Dollar bulls.
The 20-period Exponential Moving Average (EMA) at 1.3600 is providing cushion to the US Dollar bulls.
Meanwhile, the Relative Strength Index (RSI) (14) is making efforts for shifting into the bullish range of 60.00-80.00. An occurrence of the same will activate the bullish momentum.
An extension in a recovery move above the 61.8% Fibo retracement at 1.3650 will trigger a reversal and will drive the major toward the round-level resistance at 1.3700. A break above the same will expose the asset to March 22 high at 1.3745.
On the flip side, a decisive break below May 02 low at 1.3529 will expose the asset to psychological support at 1.3500 followed by a 23.6% Fibo retracement at 1.3438.
Technical Levels: Supports and Resistances
USDCAD currently trading at 1.3625 at the time of writing. Pair opened at 1.3626 and is trading with a change of -0.01 % .
| Overview | Overview.1 | |
|---|---|---|
| 0 | Today last price | 1.3625 |
| 1 | Today Daily Change | -0.0001 |
| 2 | Today Daily Change % | -0.0100 |
| 3 | Today daily open | 1.3626 |
The pair remains strongly bullish on the daily timeframe. It trades above its 20 SMA @ 1.3498, 50 SMA 1.3589, 100 SMA @ 1.3527 and 200 SMA @ 1.3436.
| Trends | Trends.1 | |
|---|---|---|
| 0 | Daily SMA20 | 1.3498 |
| 1 | Daily SMA50 | 1.3589 |
| 2 | Daily SMA100 | 1.3527 |
| 3 | Daily SMA200 | 1.3436 |
The previous day high was 1.3638 while the previous day low was 1.3529. The daily 38.2% Fib levels comes at 1.3596, expected to provide support. Similarly, the daily 61.8% fib level is at 1.357, expected to provide support.
Note the levels of interest below:
- Pivot support is noted at 1.3557, 1.3488, 1.3448
- Pivot resistance is noted at 1.3666, 1.3706, 1.3775
| Levels | Levels.1 |
|---|---|
| Previous Daily High | 1.3638 |
| Previous Daily Low | 1.3529 |
| Previous Weekly High | 1.3668 |
| Previous Weekly Low | 1.3523 |
| Previous Monthly High | 1.3668 |
| Previous Monthly Low | 1.3301 |
| Daily Fibonacci 38.2% | 1.3596 |
| Daily Fibonacci 61.8% | 1.3570 |
| Daily Pivot Point S1 | 1.3557 |
| Daily Pivot Point S2 | 1.3488 |
| Daily Pivot Point S3 | 1.3448 |
| Daily Pivot Point R1 | 1.3666 |
| Daily Pivot Point R2 | 1.3706 |
| Daily Pivot Point R3 | 1.3775 |
[/s2If]
Nehcap Expert Advisor
The NEHCAP MT4 EA is high quality professional trading system geared to generate returns without using GRID or martingales. Each trade has strict risk per trade parameter. The pairs under management include EURUSD, GBPUSD, AUDCAD, AUDNZD,GBPAUD, EURAUD, EURCAD, CHFJPY and many more.
The system is trading live: LIVE ACCOUNT TRACKING
You can run it free. Apply for a free trial and track our account. Buy the system or use profit share mechanism to generate returns on your MT4.
Join Our Telegram Group


