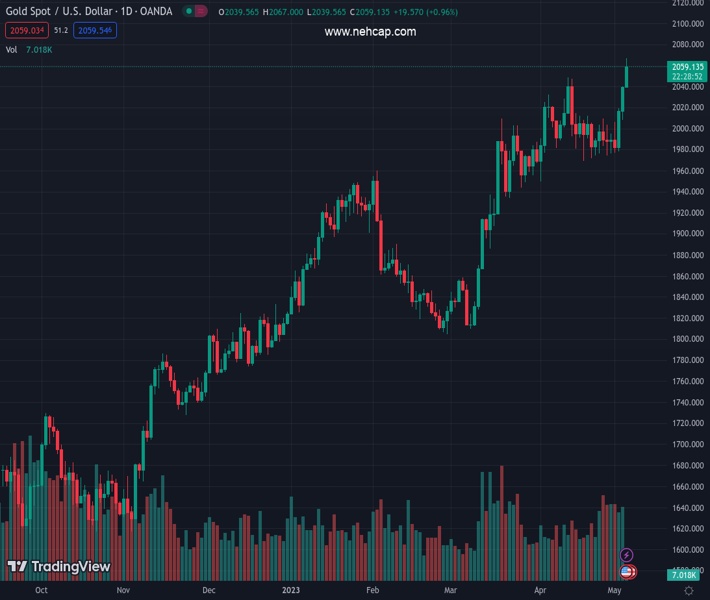
#XAUUSD @ 2,058.40 Gold price has displayed some correction after posting a fresh YTD high at $2,079.76. (Pivot Orderbook analysis)
…
This is a premium post.
[s2If !current_user_can(access_s2member_level4)]Please register for FREE REGISTER to read full post below containing analysis. In case of any error or you think you are not able to read the full post below, please email us at support#nehcap.com [lwa][/s2If] [s2If current_user_can(access_s2member_level1)]
- Gold price has displayed some correction after posting a fresh YTD high at $2,079.76.
- The Fed announced that further monetary policy decisions would be highly dependent on incoming data.
- Investors are worried that US labor market conditions are still tight and could accelerate persistent inflation.
The pair currently trades last at 2058.40.
The previous day high was 2019.43 while the previous day low was 1978.51. The daily 38.2% Fib levels comes at 2003.8, expected to provide support. Similarly, the daily 61.8% fib level is at 1994.14, expected to provide support.
Gold price (XAU/USD) has witnessed a steep fall after printing a fresh year-to-date (YTD) high placed at $2,067.00 in the early Asian session. The yellow metal has attracted significant offers as the US Dollar Index (DXY) has attempted a recovery. Earlier, the precious metal gained immense strength as the Federal Reserve (Fed) signaled a pause in the policy-tightening spell from June after hiking interest rates by 25 basis points (bps) to 5.00-5.25%.
Fed chair Jerome Powell announced that further monetary policy decisions would be highly dependent on incoming data. The Fed is moving from its prior language of ‘some additional policy firmly’ to ‘closely monitoring incoming information’ suggesting that monetary policy is restrictive enough for now to curb sticky inflation.
Meanwhile, S&P500 futures settled Wednesday’s session on a bearish note after surrendering stellar gains amid uncertainty over the further path of arresting sticky inflation, portraying a risk-aversion theme.
The US Dollar Index (DXY) is showing signs of recovery after a steep correction to near 101.26. Investors are worried that the United States labor market conditions are still tight and could accelerate persistent inflation.
On Wednesday, the US Automatic Data Processing (ADP) agency showed an addition of fresh payrolls at 296K vs. the estimates of 150K and the former release of 145K. If incoming information continues to remain expansionary in this way, the Fed won’t have another option than to hike interest rates further.
Gold price has sensed selling pressure after printing a fresh YTD at $2,079.76 as profit-booking kicked in. The precious metal has conquered its prior resistance plotted from 07 August 2020 high at $2,075.22. Intermediate support is placed from April 21 low at $1,969.29.
The 10-period Exponential Moving Average (EMA) at $1,973.73 is providing cushion to the Gold bulls.
Meanwhile, the Relative Strength Index (RSI) (14) is oscillating in the bullish range of 60.00-80.00, indicating a continuation of the upside momentum.
Technical Levels: Supports and Resistances
XAUUSD currently trading at 2050.44 at the time of writing. Pair opened at 2016.67 and is trading with a change of 1.67 % .
| Overview | Overview.1 | |
|---|---|---|
| 0 | Today last price | 2050.44 |
| 1 | Today Daily Change | 33.77 |
| 2 | Today Daily Change % | 1.67 |
| 3 | Today daily open | 2016.67 |
The pair remains strongly bullish on the daily timeframe. It trades above its 20 SMA @ 2001.95, 50 SMA 1940.31, 100 SMA @ 1901.75 and 200 SMA @ 1810.17.
| Trends | Trends.1 | |
|---|---|---|
| 0 | Daily SMA20 | 2001.95 |
| 1 | Daily SMA50 | 1940.31 |
| 2 | Daily SMA100 | 1901.75 |
| 3 | Daily SMA200 | 1810.17 |
The previous day high was 2019.43 while the previous day low was 1978.51. The daily 38.2% Fib levels comes at 2003.8, expected to provide support. Similarly, the daily 61.8% fib level is at 1994.14, expected to provide support.
Note the levels of interest below:
- Pivot support is noted at 1990.31, 1963.95, 1949.39
- Pivot resistance is noted at 2031.23, 2045.79, 2072.15
| Levels | Levels.1 |
|---|---|
| Previous Daily High | 2019.43 |
| Previous Daily Low | 1978.51 |
| Previous Weekly High | 2009.41 |
| Previous Weekly Low | 1974.13 |
| Previous Monthly High | 2048.75 |
| Previous Monthly Low | 1949.83 |
| Daily Fibonacci 38.2% | 2003.80 |
| Daily Fibonacci 61.8% | 1994.14 |
| Daily Pivot Point S1 | 1990.31 |
| Daily Pivot Point S2 | 1963.95 |
| Daily Pivot Point S3 | 1949.39 |
| Daily Pivot Point R1 | 2031.23 |
| Daily Pivot Point R2 | 2045.79 |
| Daily Pivot Point R3 | 2072.15 |
[/s2If]
Nehcap Expert Advisor
The NEHCAP MT4 EA is high quality professional trading system geared to generate returns without using GRID or martingales. Each trade has strict risk per trade parameter. The pairs under management include EURUSD, GBPUSD, AUDCAD, AUDNZD,GBPAUD, EURAUD, EURCAD, CHFJPY and many more.
The system is trading live: LIVE ACCOUNT TRACKING
You can run it free. Apply for a free trial and track our account. Buy the system or use profit share mechanism to generate returns on your MT4.
Join Our Telegram Group


