#XAUUSD @ 2,024.18 Gold recovered its bright after a drop toward its weekly low at $2007.79. (Pivot Orderbook analysis)
…
This is a premium post.
[s2If !current_user_can(access_s2member_level4)]Please register for FREE REGISTER to read full post below containing analysis. In case of any error or you think you are not able to read the full post below, please email us at support#nehcap.com [lwa][/s2If] [s2If current_user_can(access_s2member_level1)]
- Gold recovered its bright after a drop toward its weekly low at $2007.79.
- ADP Employment Change report surprises with huge hiring increase, though failed to underpin the US Dollar.
- ISM’s Non-Manufacturing PMI for April shows hiring moderation and lower input prices
The pair currently trades last at 2024.18.
The previous day high was 2019.43 while the previous day low was 1978.51. The daily 38.2% Fib levels comes at 2003.8, expected to provide support. Similarly, the daily 61.8% fib level is at 1994.14, expected to provide support.
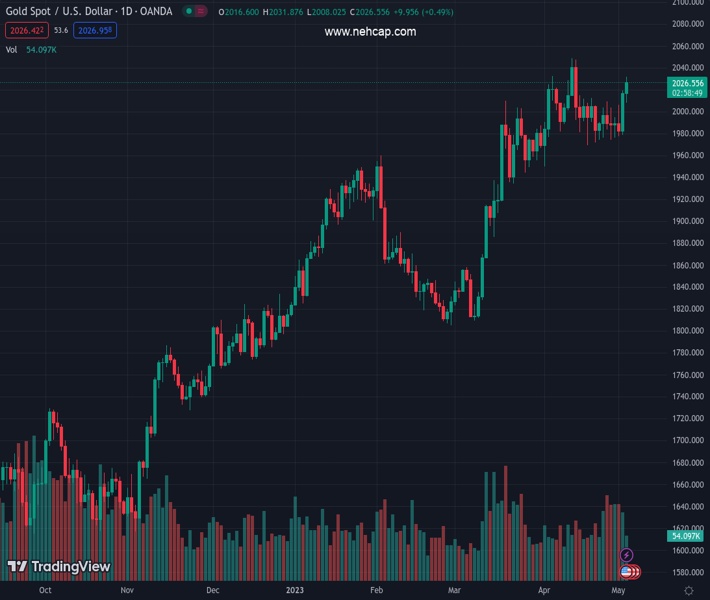
Gold price advances to two-week highs as the Federal Reserve Open Market Committee (FOMC) decision looms. Estimates are that the Federal Reserve will hike rates by 25 bps, though uncertainty around the Fed Chair Jerome Powell’s press conference keeps investors uneasy. The XAU/USD is trading at $2026.76.
Sentiment remains upbeat as Wall Street post gains, ahead of the FOMC’s decision. The latest round of data from the United States was positive, though it gave the Fed the green light to continue tightening monetary conditions.
Firstly, the April ADP Employment Change report showed that private hiring rose by 296K, crushing estimates of 148K, though it did little to weigh on the Gold price, which continues to trend higher. However, on the data release, it dipped toward 2007, though it offered buyers a better entry price to lift prices to fresh two-week highs.
Later, the ISM revealed April’s Non-Manufacturing PMI, which came at 51.9 above the prior’s month data. The report highlights that hiring continued though it moderated, while the price subcomponent remained nearby the lowest levels since 2020.
Ahead of the FOMC’s decision, traders seemed convinced of the Fed’s 25 bps rate hike, as the CME FedWatch Tool shows an 88.2% chance.
Furthermore, the fall of US Treasury bond yields has been another reason for the XAU/USD’s gains throughout the session. The US 10-year Treasury bond yield is dropping 5 bps, yielding 3.386%.
Most analysts speculate that today’s decision could be the latest hike of the current tightening cycle of the Federal Reserve. It should be said that May’s decision would not update Fed officials’ projections regarding the economy’s general health. The June meeting will unveil the Summary of Economic Projections (SEP).
Technical Levels: Supports and Resistances
XAUUSD currently trading at 2028.05 at the time of writing. Pair opened at 2016.67 and is trading with a change of 0.56 % .
| Overview | Overview.1 | |
|---|---|---|
| 0 | Today last price | 2028.05 |
| 1 | Today Daily Change | 11.38 |
| 2 | Today Daily Change % | 0.56 |
| 3 | Today daily open | 2016.67 |
The pair remains strongly bullish on the daily timeframe. It trades above its 20 SMA @ 2001.95, 50 SMA 1940.31, 100 SMA @ 1901.75 and 200 SMA @ 1810.17.
| Trends | Trends.1 | |
|---|---|---|
| 0 | Daily SMA20 | 2001.95 |
| 1 | Daily SMA50 | 1940.31 |
| 2 | Daily SMA100 | 1901.75 |
| 3 | Daily SMA200 | 1810.17 |
The previous day high was 2019.43 while the previous day low was 1978.51. The daily 38.2% Fib levels comes at 2003.8, expected to provide support. Similarly, the daily 61.8% fib level is at 1994.14, expected to provide support.
Note the levels of interest below:
- Pivot support is noted at 1990.31, 1963.95, 1949.39
- Pivot resistance is noted at 2031.23, 2045.79, 2072.15
| Levels | Levels.1 |
|---|---|
| Previous Daily High | 2019.43 |
| Previous Daily Low | 1978.51 |
| Previous Weekly High | 2009.41 |
| Previous Weekly Low | 1974.13 |
| Previous Monthly High | 2048.75 |
| Previous Monthly Low | 1949.83 |
| Daily Fibonacci 38.2% | 2003.80 |
| Daily Fibonacci 61.8% | 1994.14 |
| Daily Pivot Point S1 | 1990.31 |
| Daily Pivot Point S2 | 1963.95 |
| Daily Pivot Point S3 | 1949.39 |
| Daily Pivot Point R1 | 2031.23 |
| Daily Pivot Point R2 | 2045.79 |
| Daily Pivot Point R3 | 2072.15 |
[/s2If]
Nehcap Expert Advisor
The NEHCAP MT4 EA is high quality professional trading system geared to generate returns without using GRID or martingales. Each trade has strict risk per trade parameter. The pairs under management include EURUSD, GBPUSD, AUDCAD, AUDNZD,GBPAUD, EURAUD, EURCAD, CHFJPY and many more.
The system is trading live: LIVE ACCOUNT TRACKING
You can run it free. Apply for a free trial and track our account. Buy the system or use profit share mechanism to generate returns on your MT4.
Join Our Telegram Group
")


