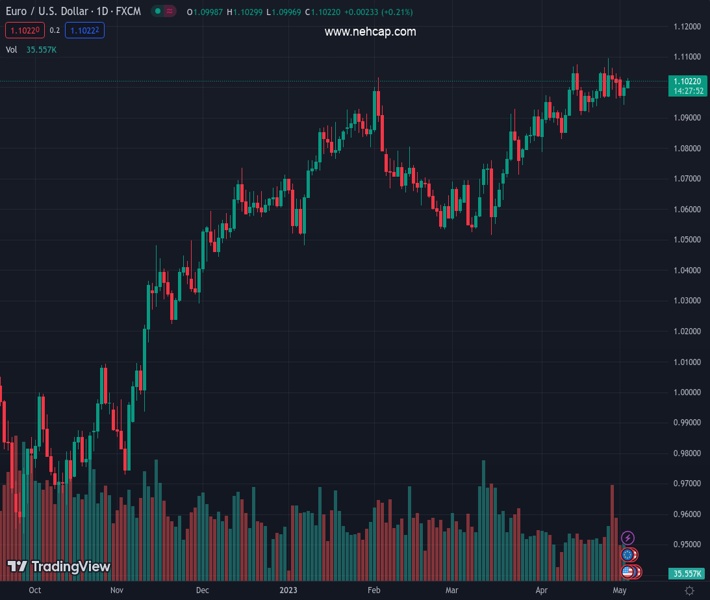
#EURUSD @ 1.10191 has faced a marginal correction around 1.1030 as the USD Index has attempted a recovery. (Pivot Orderbook analysis)
…
This is a premium post.
[s2If !current_user_can(access_s2member_level4)]Please register for FREE REGISTER to read full post below containing analysis. In case of any error or you think you are not able to read the full post below, please email us at support#nehcap.com [lwa][/s2If] [s2If current_user_can(access_s2member_level1)]
- EUR/USD has faced a marginal correction around 1.1030 as the USD Index has attempted a recovery.
- The Fed and the ECB are preparing for a fresh interest rate hike cycle to curb sticky inflation.
- EUR/USD has delivered a breakout of the downward-sloping trendline plotted from 1.1063.
The pair currently trades last at 1.10191.
The previous day high was 1.1008 while the previous day low was 1.0942. The daily 38.2% Fib levels comes at 1.0983, expected to provide support. Similarly, the daily 61.8% fib level is at 1.0967, expected to provide support.
The EUR/USD pair has shown a marginal correction after facing fragile barricades around 1.1030 in the early European session. The major currency pair has sensed selling pressure as the US Dollar Index (DXY) has attempted a recovery after dropping to near 101.70.
Sheer volatility is anticipated ahead as the Federal Reserve (Fed) will announce its monetary policy decision on Wednesday. The street is anticipating an interest rate hike by 25 basis points (bps).
Also, the European Central Bank (ECB) will announce its interest rate policy on Thursday. ECB President Christine Lagarde is expected to continue its bumper interest rate hike measure as Eurozone’s inflation is extremely stubborn amid labor shortages.
EUR/USD has delivered a breakout of the downward-sloping trendline plotted from April 27 high at 1.1063. The Euro is showing a mild correction, testing the breakout scenario. Potential resistance is placed at 1.1095 plotted from April 26 high.
Advancing 20-period Exponential Moving Average (EMA) at 1.1007 indicates that the short-term trend is bullish.
The Relative Strength Index (RSI) (14) has shifted into the bullish range of 60.00-80.00, which signifies that upside momentum has been activated.
The major currency pair will capture more gains after a decisive move above the intraday high of 1.1030, which will drive it toward the round-level resistance at 1.1100. A breach of the latter will expose the shared currency pair to a fresh 13-month high at 1.1085.
On the flip side, a downside move below April 12 low at 1.0915 will drag the asset toward April 10 low at 1.0837 and April 03 low at 1.0788.
Technical Levels: Supports and Resistances
EURUSD currently trading at 1.1017 at the time of writing. Pair opened at 1.1002 and is trading with a change of 0.14 % .
| Overview | Overview.1 | |
|---|---|---|
| 0 | Today last price | 1.1017 |
| 1 | Today Daily Change | 0.0015 |
| 2 | Today Daily Change % | 0.1400 |
| 3 | Today daily open | 1.1002 |
The pair remains strongly bullish on the daily timeframe. It trades above its 20 SMA @ 1.0971, 50 SMA 1.0812, 100 SMA @ 1.077 and 200 SMA @ 1.0422.
| Trends | Trends.1 | |
|---|---|---|
| 0 | Daily SMA20 | 1.0971 |
| 1 | Daily SMA50 | 1.0812 |
| 2 | Daily SMA100 | 1.0770 |
| 3 | Daily SMA200 | 1.0422 |
The previous day high was 1.1008 while the previous day low was 1.0942. The daily 38.2% Fib levels comes at 1.0983, expected to provide support. Similarly, the daily 61.8% fib level is at 1.0967, expected to provide support.
Note the levels of interest below:
- Pivot support is noted at 1.096, 1.0918, 1.0894
- Pivot resistance is noted at 1.1026, 1.105, 1.1091
| Levels | Levels.1 |
|---|---|
| Previous Daily High | 1.1008 |
| Previous Daily Low | 1.0942 |
| Previous Weekly High | 1.1095 |
| Previous Weekly Low | 1.0962 |
| Previous Monthly High | 1.1095 |
| Previous Monthly Low | 1.0788 |
| Daily Fibonacci 38.2% | 1.0983 |
| Daily Fibonacci 61.8% | 1.0967 |
| Daily Pivot Point S1 | 1.0960 |
| Daily Pivot Point S2 | 1.0918 |
| Daily Pivot Point S3 | 1.0894 |
| Daily Pivot Point R1 | 1.1026 |
| Daily Pivot Point R2 | 1.1050 |
| Daily Pivot Point R3 | 1.1091 |
[/s2If]
Nehcap Expert Advisor
The NEHCAP MT4 EA is high quality professional trading system geared to generate returns without using GRID or martingales. Each trade has strict risk per trade parameter. The pairs under management include EURUSD, GBPUSD, AUDCAD, AUDNZD,GBPAUD, EURAUD, EURCAD, CHFJPY and many more.
The system is trading live: LIVE ACCOUNT TRACKING
You can run it free. Apply for a free trial and track our account. Buy the system or use profit share mechanism to generate returns on your MT4.
Join Our Telegram Group
")


