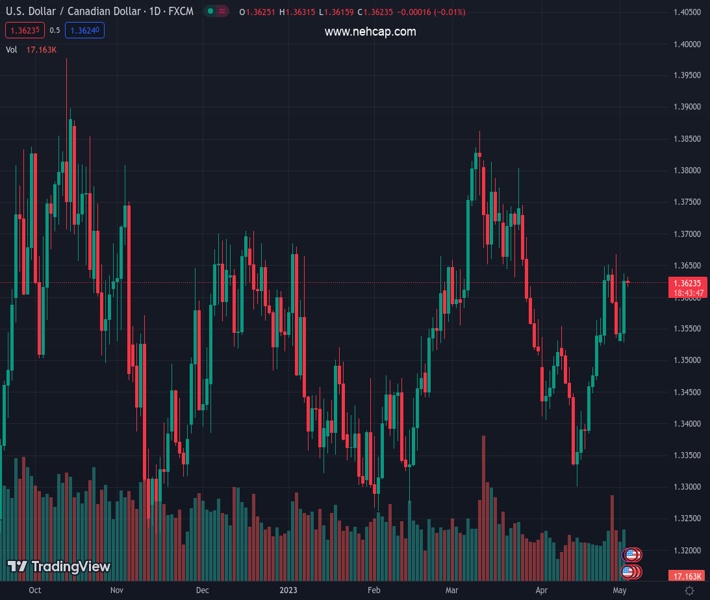
#USDCAD @ 1.36226 has turned sideways after a perpendicular rally inspired by weaker oil prices. (Pivot Orderbook analysis)
…
This is a premium post.
[s2If !current_user_can(access_s2member_level4)]Please register for FREE REGISTER to read full post below containing analysis. In case of any error or you think you are not able to read the full post below, please email us at support#nehcap.com [lwa][/s2If] [s2If current_user_can(access_s2member_level1)]
- USD/CAD has turned sideways after a perpendicular rally inspired by weaker oil prices.
- The USD Index has dropped sharply to near 101.75 as investors are anticipating neutral guidance from the Fed.
- USD/CAD is approaching the critical supply zone plotted in a range of 1.3648-1.3667.
The pair currently trades last at 1.36226.
The previous day high was 1.3638 while the previous day low was 1.3529. The daily 38.2% Fib levels comes at 1.3596, expected to provide support. Similarly, the daily 61.8% fib level is at 1.357, expected to provide support.
The USD/CAD pair is displaying a sideways performance around 1.3620 in the Tokyo session. The Loonie asset displayed a perpendicular rally after defending the crucial support of 1.3540 as oil prices nosedived amid deepening fears of a recession in the United States.
The oil price has refreshed its monthly low at $71.50 and is prone to the further downside as more central banks are preparing for a fresh interest rate hike to curb sticky inflation. It is worth noting that Canada is the leading exporter of oil to the US and lower oil prices are impacting the Canadian Dollar.
Meanwhile, the US Dollar Index (DXY) has dropped sharply to near 101.75 as investors are anticipating neutral guidance from the Federal Reserve (Fed). Also, expectations of an increase in the US debt ceiling are weighing on the USD Index as it will hurt the long-term outlook of the US economy.
After sensing a steel buying interest near the demand zone placed in a narrow range of 1.3525-1.3556, USD/CAD is approaching the critical supply zone plotted in a range of 1.3648-1.3667. The Loonie asset has shifted its auction above the 20-period Exponential Moving Average (EMA) at 1.3588, which indicates that the short-term trend is bullish.
The Relative Strength Index (RSI) (14) has rebounded after sensing support near 40.00 and is making efforts in climbing above 60.00, which will result in an activation of the bullish momentum.
Should the asset break above April 28 high at 1.3668, US Dollar bulls will drive the major toward the round-level resistance at 1.3700. A break above the same will expose the asset to March 22 high at 1.3745.
On the flip side, a downside move below May 02 low at 1.3529 will expose the asset to the psychological support at 1.3500 followed by February 21 low at 1.3441.
Technical Levels: Supports and Resistances
USDCAD currently trading at 1.3621 at the time of writing. Pair opened at 1.3626 and is trading with a change of -0.04 % .
| Overview | Overview.1 | |
|---|---|---|
| 0 | Today last price | 1.3621 |
| 1 | Today Daily Change | -0.0005 |
| 2 | Today Daily Change % | -0.0400 |
| 3 | Today daily open | 1.3626 |
The pair remains strongly bullish on the daily timeframe. It trades above its 20 SMA @ 1.3498, 50 SMA 1.3589, 100 SMA @ 1.3527 and 200 SMA @ 1.3436.
| Trends | Trends.1 | |
|---|---|---|
| 0 | Daily SMA20 | 1.3498 |
| 1 | Daily SMA50 | 1.3589 |
| 2 | Daily SMA100 | 1.3527 |
| 3 | Daily SMA200 | 1.3436 |
The previous day high was 1.3638 while the previous day low was 1.3529. The daily 38.2% Fib levels comes at 1.3596, expected to provide support. Similarly, the daily 61.8% fib level is at 1.357, expected to provide support.
Note the levels of interest below:
- Pivot support is noted at 1.3557, 1.3488, 1.3448
- Pivot resistance is noted at 1.3666, 1.3706, 1.3775
| Levels | Levels.1 |
|---|---|
| Previous Daily High | 1.3638 |
| Previous Daily Low | 1.3529 |
| Previous Weekly High | 1.3668 |
| Previous Weekly Low | 1.3523 |
| Previous Monthly High | 1.3668 |
| Previous Monthly Low | 1.3301 |
| Daily Fibonacci 38.2% | 1.3596 |
| Daily Fibonacci 61.8% | 1.3570 |
| Daily Pivot Point S1 | 1.3557 |
| Daily Pivot Point S2 | 1.3488 |
| Daily Pivot Point S3 | 1.3448 |
| Daily Pivot Point R1 | 1.3666 |
| Daily Pivot Point R2 | 1.3706 |
| Daily Pivot Point R3 | 1.3775 |
[/s2If]
Nehcap Expert Advisor
The NEHCAP MT4 EA is high quality professional trading system geared to generate returns without using GRID or martingales. Each trade has strict risk per trade parameter. The pairs under management include EURUSD, GBPUSD, AUDCAD, AUDNZD,GBPAUD, EURAUD, EURCAD, CHFJPY and many more.
The system is trading live: LIVE ACCOUNT TRACKING
You can run it free. Apply for a free trial and track our account. Buy the system or use profit share mechanism to generate returns on your MT4.
Join Our Telegram Group


