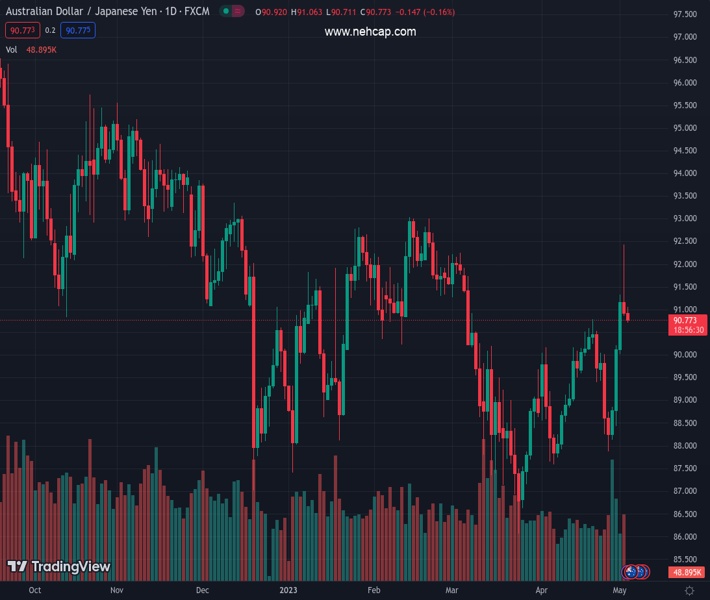
#AUDJPY @ 90.7370 holds lower grounds after reversing from 10 week high the previous day. (Pivot Orderbook analysis)
…
This is a premium post.
[s2If !current_user_can(access_s2member_level4)]Please register for FREE REGISTER to read full post below containing analysis. In case of any error or you think you are not able to read the full post below, please email us at support#nehcap.com [lwa][/s2If] [s2If current_user_can(access_s2member_level1)]
- AUD/JPY holds lower grounds after reversing from 10 week high the previous day.
- Australia Retail Sales for March rose 0.4%, AiG, S&P Global PMIs came in mixed.
- Markets in Japan and China are off but RBA versus BoJ divergence can keep buyers hopeful.
- Challenges to sentiment from pre-Fed anxiety, banking woes and US default fears weigh on risk-barometer pair.
The pair currently trades last at 90.7370.
The previous day high was 92.44 while the previous day low was 90.86. The daily 38.2% Fib levels comes at 91.46, expected to provide resistance. Similarly, the daily 61.8% fib level is at 91.83, expected to provide resistance.
AUD/JPY remains depressed around 90.85, keeping the previous day’s losses near the highest levels in 2.5 months, even as Australia’s Retail Sales for March manage to print upbeat figures for March early Wednesday. In doing so, the quote portrays a cautious mood ahead of the top-tier data/events. Also challenging the cross-currency pair are the holidays in China and Japan, as well as fears emanating from baking sector fallouts and hawkish central bank bias, backed by the latest surprise from the Reserve Bank of Australia (RBA).
Australia’s seasonally adjusted Retail Sales for March rose 0.4% versus market expectations of witnessing a 0.2% steady growth number.
Also read: Aussie Retail Sales beats at 0.4% vs. 0.2%
Earlier in the day, Australia’s AiG Industry Index for March rose to 20.1 versus -6.1 prior whereas the AiG Manufacturing and Construction PMIs for the said month dropped to -20.2 and -12.4 respective levels versus -5.8 and 5.6 priors in that order. Further, S&P Global Services PMI for April improved to 53.7 versus 52.6 initial forecasts while the Composite PMI also rose to 53.0 from 52.2 first estimations for the said month.
On a different page, fresh selling of PacWest Bancorp and Western Alliance Bancorp shares triggered banking fears across the board, which in turn exerts downside pressure on the AUD/JPY prices due to the pair’s risk-barometer status. Also portraying the risk-aversion wave is the mildly offered S&P 500 Futures and the downbeat close of Wall Street.
It should be noted that the RBA board members surprised AUD/JPY pair traders the previous day by lifting the Official Cash Rate (OCR) by 25 basis points (bps) to 3.85%. Not only does the RBA announce a 0.25% rate hike but the Aussie central bank also expects further tightening of the monetary policy. That said, the RBA also revised its inflation and Gross Domestic Product (GDP) forecasts in the latest policy document. Additionally, RBA Governor Philip Lowe repeated that some further tightening may be required to bring inflation back to the 2-3% target within a reasonable timeframe.
Elsewhere, the latest divergence between the RBA and the Bank of Japan (BoJ) monetary policy outlook seems to propel the AUD/JPY prices. However, Australian trade numbers, China Caixin Manufacturing PMI for April and the risk catalysts will be more important to watch for clear directions.
Failure to provide a daily closing beyond a downward-sloping resistance line from late October, around 91.30 by the press time, keeps AUD/JPY bears hopeful of revisiting the 100-DMA support surrounding $90.20.
Technical Levels: Supports and Resistances
AUDJPY currently trading at 90.84 at the time of writing. Pair opened at 91.01 and is trading with a change of -0.19% % .
| Overview | Overview.1 | |
|---|---|---|
| 0 | Today last price | 90.84 |
| 1 | Today Daily Change | -0.17 |
| 2 | Today Daily Change % | -0.19% |
| 3 | Today daily open | 91.01 |
The pair is trading above its 20 Daily moving average @ 89.47, above its 50 Daily moving average @ 89.57 , above its 100 Daily moving average @ 90.21 and below its 200 Daily moving average @ 92.16
| Trends | Trends.1 | |
|---|---|---|
| 0 | Daily SMA20 | 89.47 |
| 1 | Daily SMA50 | 89.57 |
| 2 | Daily SMA100 | 90.21 |
| 3 | Daily SMA200 | 92.16 |
The previous day high was 92.44 while the previous day low was 90.86. The daily 38.2% Fib levels comes at 91.46, expected to provide resistance. Similarly, the daily 61.8% fib level is at 91.83, expected to provide resistance.
Note the levels of interest below:
- Pivot support is noted at 90.43, 89.85, 88.85
- Pivot resistance is noted at 92.01, 93.02, 93.6
| Levels | Levels.1 |
|---|---|
| Previous Daily High | 92.44 |
| Previous Daily Low | 90.86 |
| Previous Weekly High | 90.22 |
| Previous Weekly Low | 87.87 |
| Previous Monthly High | 90.78 |
| Previous Monthly Low | 87.59 |
| Daily Fibonacci 38.2% | 91.46 |
| Daily Fibonacci 61.8% | 91.83 |
| Daily Pivot Point S1 | 90.43 |
| Daily Pivot Point S2 | 89.85 |
| Daily Pivot Point S3 | 88.85 |
| Daily Pivot Point R1 | 92.01 |
| Daily Pivot Point R2 | 93.02 |
| Daily Pivot Point R3 | 93.60 |
[/s2If]
Nehcap Expert Advisor
The NEHCAP MT4 EA is high quality professional trading system geared to generate returns without using GRID or martingales. Each trade has strict risk per trade parameter. The pairs under management include EURUSD, GBPUSD, AUDCAD, AUDNZD,GBPAUD, EURAUD, EURCAD, CHFJPY and many more.
The system is trading live: LIVE ACCOUNT TRACKING
You can run it free. Apply for a free trial and track our account. Buy the system or use profit share mechanism to generate returns on your MT4.
Join Our Telegram Group


