Oil prices showed a bloodbath as fears of US recession soars ahead of Fed policy. (Pivot Orderbook analysis)
…
This is a premium post.
[s2If !current_user_can(access_s2member_level4)]Please register for FREE REGISTER to read full post below containing analysis. In case of any error or you think you are not able to read the full post below, please email us at support#nehcap.com [lwa][/s2If] [s2If current_user_can(access_s2member_level1)]
- Oil prices showed a bloodbath as fears of US recession soars ahead of Fed policy.
- The USD Index has extended its correction as Fed rate hikes were having a negative impact on the banking sector.
- Oil inventory data from the US EIA will remain in the spotlight.
The pair currently trades last at 71.51.
The previous day high was 76.03 while the previous day low was 71.37. The daily 38.2% Fib levels comes at 73.15, expected to provide resistance. Similarly, the daily 61.8% fib level is at 74.25, expected to provide resistance.
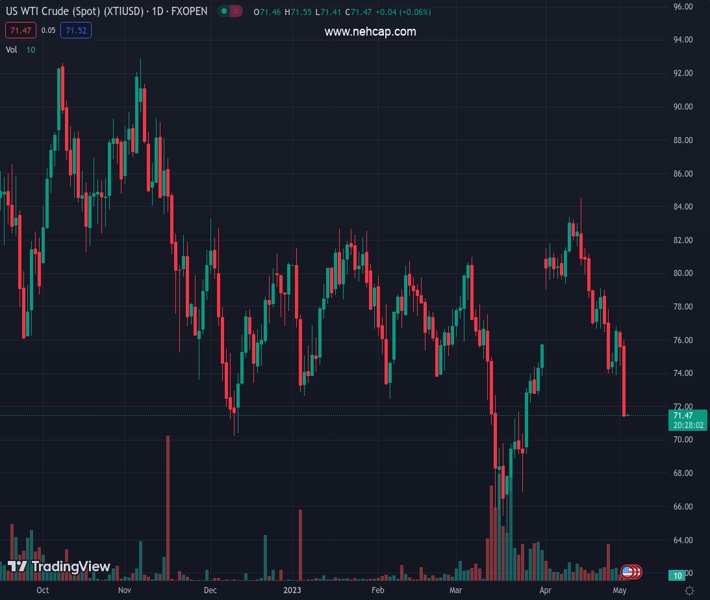
West Texas Intermediate (WTI), futures on NYMEX, are seeking support around $71.50 in the Asian session after a bloodbath on Tuesday. The black gold was heavily dumped as investors got cautious that more interest rate hikes from the Federal Reserve (Fed) will deepen fears of a recession in the United States.
Also, a delay in US debt ceiling talks is accelerating anxiety among market participants as US President Joe Biden is not interested in meeting with US Senate McCarthy if Republicans want negotiation.
Meanwhile, the US Dollar Index (DXY) has extended its correction to near 101.86 as a member of the Council of US Economic Advisers, Heather Boushey, said that interest rate hikes from the Fed were having a negative impact on the banking sector, as reported by Reuters.
Going forward, oil inventory data from the US Energy Information Administration (EIA) will remain in the spotlight.
The oil price is declining toward its annual low plotted from March 20 low at $64.39 on a daily scale. The black gold witnessed immense selling pressure after failing to surpass the horizontal resistance placed from January 23 high at $82.68.
The 10-period Exponential Moving Average (EMA) at $75.20 is acting as a barricade for the oil price.
Also, the Relative Strength Index (RSI) (14) has slipped below 40.00. Further downside seems possible amid the absence of divergence and oversold signals.
Oil bears will further drag the asset towards 09 December 2022 low at $70.27 and March 24 low at $66.88 after dropping below May 02 low at $71.37.
Alternatively, a confident break above April 03 low at $79.00 will drive the oil price toward April 04 high at $81.80 and April 12 high at $83.40.
Technical Levels: Supports and Resistances
XTIUSD currently trading at 71.51 at the time of writing. Pair opened at 71.5 and is trading with a change of 0.01 % .
| Overview | Overview.1 | |
|---|---|---|
| 0 | Today last price | 71.51 |
| 1 | Today Daily Change | 0.01 |
| 2 | Today Daily Change % | 0.01 |
| 3 | Today daily open | 71.50 |
The pair remains strongly bearish on the daily time frame. It trades below the 20 SMA @ 78.78, 50 SMA 75.98, 100 SMA @ 77.02 and 200 SMA @ 81.39.
| Trends | Trends.1 | |
|---|---|---|
| 0 | Daily SMA20 | 78.78 |
| 1 | Daily SMA50 | 75.98 |
| 2 | Daily SMA100 | 77.02 |
| 3 | Daily SMA200 | 81.39 |
The previous day high was 76.03 while the previous day low was 71.37. The daily 38.2% Fib levels comes at 73.15, expected to provide resistance. Similarly, the daily 61.8% fib level is at 74.25, expected to provide resistance.
Note the levels of interest below:
- Pivot support is noted at 69.9, 68.3, 65.24
- Pivot resistance is noted at 74.56, 77.63, 79.22
| Levels | Levels.1 |
|---|---|
| Previous Daily High | 76.03 |
| Previous Daily Low | 71.37 |
| Previous Weekly High | 79.14 |
| Previous Weekly Low | 73.88 |
| Previous Monthly High | 83.40 |
| Previous Monthly Low | 73.88 |
| Daily Fibonacci 38.2% | 73.15 |
| Daily Fibonacci 61.8% | 74.25 |
| Daily Pivot Point S1 | 69.90 |
| Daily Pivot Point S2 | 68.30 |
| Daily Pivot Point S3 | 65.24 |
| Daily Pivot Point R1 | 74.56 |
| Daily Pivot Point R2 | 77.63 |
| Daily Pivot Point R3 | 79.22 |
[/s2If]
Nehcap Expert Advisor
The NEHCAP MT4 EA is high quality professional trading system geared to generate returns without using GRID or martingales. Each trade has strict risk per trade parameter. The pairs under management include EURUSD, GBPUSD, AUDCAD, AUDNZD,GBPAUD, EURAUD, EURCAD, CHFJPY and many more.
The system is trading live: LIVE ACCOUNT TRACKING
You can run it free. Apply for a free trial and track our account. Buy the system or use profit share mechanism to generate returns on your MT4.
Join Our Telegram Group


