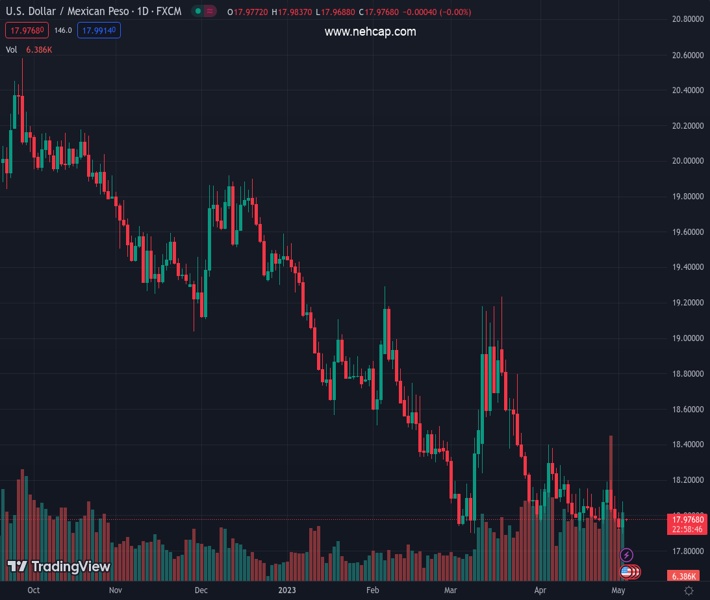
#USDMXN @ 17.9774 snaps three-day losing streak as sentiment sours over possible US debt default. (Pivot Orderbook analysis)
…
This is a premium post.
[s2If !current_user_can(access_s2member_level4)]Please register for FREE REGISTER to read full post below containing analysis. In case of any error or you think you are not able to read the full post below, please email us at support#nehcap.com [lwa][/s2If] [s2If current_user_can(access_s2member_level1)]
- USD/MXN snaps three-day losing streak as sentiment sours over possible US debt default.
- The Federal Reserve is expected to raise rates, while Banxico is estimated to keep rates on hold.
- US job openings for March fall, while US Factory Orders increased.
The pair currently trades last at 17.9774.
The previous day high was 18.0219 while the previous day low was 17.9182. The daily 38.2% Fib levels comes at 17.9578, expected to provide support. Similarly, the daily 61.8% fib level is at 17.9823, expected to provide resistance.
The Mexican Peso (MXN) erased some of its earlier gains during the North American session, as the USD/MXN pair climbs 0.20%, but it remains shy of conquering the 18.00 figure. US equities closed on a lower note as the US debt ceiling narrative takes center stage amongst the US banking turmoil. The USD/MXN is trading at 17.9792 after hitting a low of 17.8972.
The USD/MXN snapped three days of losses as sentiment shifted sour. Nervousness around a possible US debt default, as the US Treasury Secretary Janet Yellen commented that the government might run out of money by June 1, kept investors uneasy. The US Federal Reserve (Fed) is expected to raise rates above the 5% threshold, while the Mexican central bank, known s Banxico, is estimated to keep rates on hold.
Earlier, after Wall Street opened, the US Department of Labor revealed that job openings for March fell to 9.590 million, below estimates of 9.775 million, according to the JOLTs report. At the same time, the US Department of Commerce revealed that Factory Orders increased by 0.09% MoM, exceeding estimates, well above February’s data, which showed a contraction of 1.1%.
The USD/MXN shrugged off the fall of US Treasury bond yields, weakening the US Dollar. Nevertheless, when the market mood shifts sour, high beta currencies, like the Mexican Peso (MXN), weaken against the US Dollar.
The US Dollar Index (DXY), a gauge of the buck’s value against a basket of rivals, slides 0.18%, down at 101.927, bracing to the 20-day EMA.
The USD/MXN remains downward biased despite erasing last Monday’s losses. As long as the pair remains below the 20-day Exponential Moving Average (EMA) at 18.0633, further downside is expected. On the other hand, if USD/MXN buyers reclaim the latter, a rally to the 50-day EMA at 18.2539 is on the cards. Once cleared, the USD/MXN could threaten the 100-day EMA at 18.5746.
Technical Levels: Supports and Resistances
USDMXN currently trading at 17.9815 at the time of writing. Pair opened at 17.9386 and is trading with a change of 0.24 % .
| Overview | Overview.1 | |
|---|---|---|
| 0 | Today last price | 17.9815 |
| 1 | Today Daily Change | 0.0429 |
| 2 | Today Daily Change % | 0.2400 |
| 3 | Today daily open | 17.9386 |
The pair remains strongly bearish on the daily time frame. It trades below the 20 SMA @ 18.0784, 50 SMA 18.2597, 100 SMA @ 18.6598 and 200 SMA @ 19.2808.
| Trends | Trends.1 | |
|---|---|---|
| 0 | Daily SMA20 | 18.0784 |
| 1 | Daily SMA50 | 18.2597 |
| 2 | Daily SMA100 | 18.6598 |
| 3 | Daily SMA200 | 19.2808 |
The previous day high was 18.0219 while the previous day low was 17.9182. The daily 38.2% Fib levels comes at 17.9578, expected to provide support. Similarly, the daily 61.8% fib level is at 17.9823, expected to provide resistance.
Note the levels of interest below:
- Pivot support is noted at 17.8973, 17.8559, 17.7935
- Pivot resistance is noted at 18.001, 18.0633, 18.1047
| Levels | Levels.1 |
|---|---|
| Previous Daily High | 18.0219 |
| Previous Daily Low | 17.9182 |
| Previous Weekly High | 18.2000 |
| Previous Weekly Low | 17.9511 |
| Previous Monthly High | 18.4018 |
| Previous Monthly Low | 17.9329 |
| Daily Fibonacci 38.2% | 17.9578 |
| Daily Fibonacci 61.8% | 17.9823 |
| Daily Pivot Point S1 | 17.8973 |
| Daily Pivot Point S2 | 17.8559 |
| Daily Pivot Point S3 | 17.7935 |
| Daily Pivot Point R1 | 18.0010 |
| Daily Pivot Point R2 | 18.0633 |
| Daily Pivot Point R3 | 18.1047 |
[/s2If]
Nehcap Expert Advisor
The NEHCAP MT4 EA is high quality professional trading system geared to generate returns without using GRID or martingales. Each trade has strict risk per trade parameter. The pairs under management include EURUSD, GBPUSD, AUDCAD, AUDNZD,GBPAUD, EURAUD, EURCAD, CHFJPY and many more.
The system is trading live: LIVE ACCOUNT TRACKING
You can run it free. Apply for a free trial and track our account. Buy the system or use profit share mechanism to generate returns on your MT4.
Join Our Telegram Group


