#XAGUSD @ 25.340 bounced off the weekly lows below the 20-day EMA and reclaimed $25.00. (Pivot Orderbook analysis)
…
This is a premium post.
[s2If !current_user_can(access_s2member_level4)]Please register for FREE REGISTER to read full post below containing analysis. In case of any error or you think you are not able to read the full post below, please email us at support#nehcap.com [lwa][/s2If] [s2If current_user_can(access_s2member_level1)]
- XAG/USD bounced off the weekly lows below the 20-day EMA and reclaimed $25.00.
- A sour sentiment, and falling US T-bond yields, triggered flows to XAG.
- XAG/USD would remain upwards above $25.50; otherwise, sellers can drag prices to the 20-day EMA.
The pair currently trades last at 25.340.
The previous day high was 25.92 while the previous day low was 24.88. The daily 38.2% Fib levels comes at 25.28, expected to provide support. Similarly, the daily 61.8% fib level is at 25.52, expected to provide resistance.
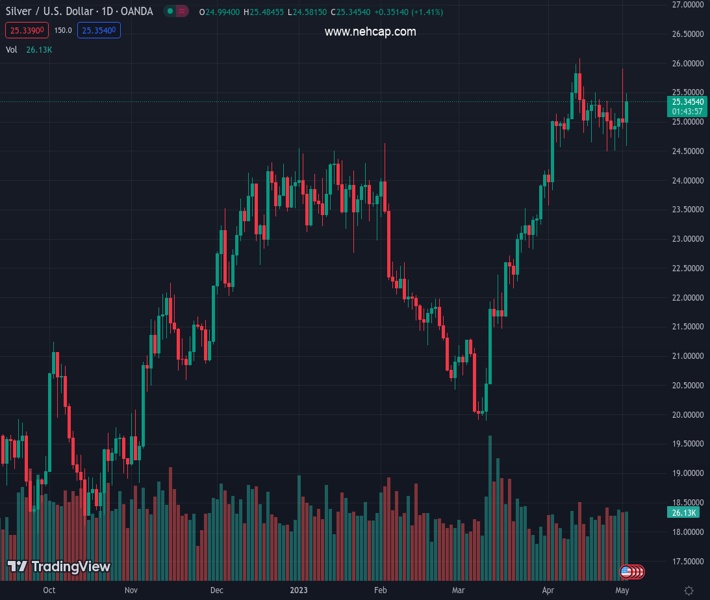
Silver price advanced late in the North American session, gaining more than 1%, as US Treasury bond yields dropped. Consequently, a softer US Dollar (USD) increased flows toward the white metal amidst a risk-off impulse. The XAG/USD is trading at $25.28 after hitting a low of $24.58.
The XAG/USD daily chart shows the white metal edged toward its May high at $25.90 on Monday before reversing its course and closing below the $25.00 figure, a tick above the 20-day Exponential Moving Average (EMA). Even though the Silver price was headed to continue to fall, it jumped off the daily low of $24.58, $0.30 below the 20-day EMA, and climbed to the bottom of an upslope support trendline drawn from March 2023 lows.
If XAG/USD buyers reclaim $25.50, that could pave the way to May’s high before challenging the YTD high at $26.08.
Conversely, if sellers stepped in around resistance at $25.50, it could exacerbate a test of the $25.00 mark before dropping to the 20-day EMA. Once cleared, the next support in play would be the February 2 high at $24.63.
Technical Levels: Supports and Resistances
XAGUSD currently trading at 25.31 at the time of writing. Pair opened at 25.0 and is trading with a change of 1.24 % .
| Overview | Overview.1 | |
|---|---|---|
| 0 | Today last price | 25.31 |
| 1 | Today Daily Change | 0.31 |
| 2 | Today Daily Change % | 1.24 |
| 3 | Today daily open | 25.00 |
The pair remains strongly bullish on the daily timeframe. It trades above its 20 SMA @ 25.08, 50 SMA 23.14, 100 SMA @ 23.24 and 200 SMA @ 21.6.
| Trends | Trends.1 | |
|---|---|---|
| 0 | Daily SMA20 | 25.08 |
| 1 | Daily SMA50 | 23.14 |
| 2 | Daily SMA100 | 23.24 |
| 3 | Daily SMA200 | 21.60 |
The previous day high was 25.92 while the previous day low was 24.88. The daily 38.2% Fib levels comes at 25.28, expected to provide support. Similarly, the daily 61.8% fib level is at 25.52, expected to provide resistance.
Note the levels of interest below:
- Pivot support is noted at 24.62, 24.24, 23.59
- Pivot resistance is noted at 25.65, 26.3, 26.68
| Levels | Levels.1 |
|---|---|
| Previous Daily High | 25.92 |
| Previous Daily Low | 24.88 |
| Previous Weekly High | 25.36 |
| Previous Weekly Low | 24.49 |
| Previous Monthly High | 26.09 |
| Previous Monthly Low | 23.57 |
| Daily Fibonacci 38.2% | 25.28 |
| Daily Fibonacci 61.8% | 25.52 |
| Daily Pivot Point S1 | 24.62 |
| Daily Pivot Point S2 | 24.24 |
| Daily Pivot Point S3 | 23.59 |
| Daily Pivot Point R1 | 25.65 |
| Daily Pivot Point R2 | 26.30 |
| Daily Pivot Point R3 | 26.68 |
[/s2If]
Nehcap Expert Advisor
The NEHCAP MT4 EA is high quality professional trading system geared to generate returns without using GRID or martingales. Each trade has strict risk per trade parameter. The pairs under management include EURUSD, GBPUSD, AUDCAD, AUDNZD,GBPAUD, EURAUD, EURCAD, CHFJPY and many more.
The system is trading live: LIVE ACCOUNT TRACKING
You can run it free. Apply for a free trial and track our account. Buy the system or use profit share mechanism to generate returns on your MT4.
Join Our Telegram Group


