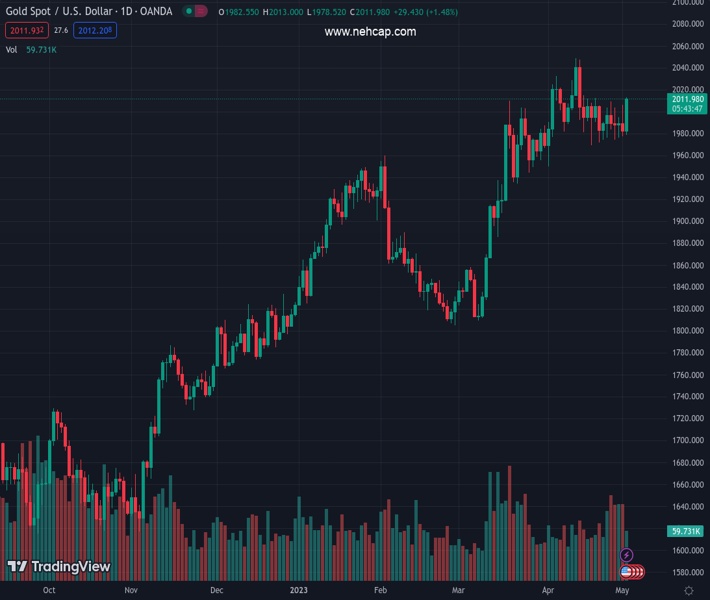
#XAUUSD @ 2,012.22 The gold price jumped over $20.00 on a risk-off impulse, lowering US T-bond yields. (Pivot Orderbook analysis)
…
This is a premium post.
[s2If !current_user_can(access_s2member_level4)]Please register for FREE REGISTER to read full post below containing analysis. In case of any error or you think you are not able to read the full post below, please email us at support#nehcap.com [lwa][/s2If] [s2If current_user_can(access_s2member_level1)]
- The gold price jumped over $20.00 on a risk-off impulse, lowering US T-bond yields.
- Sentiment deteriorated as US Treasury Secretary Yellen warns of obligation shortfall.
- US job openings decline for the third consecutive month, as shown by the JOLTs report.
The pair currently trades last at 2012.22.
The previous day high was 2006.06 while the previous day low was 1977.12. The daily 38.2% Fib levels comes at 1988.18, expected to provide support. Similarly, the daily 61.8% fib level is at 1995.0, expected to provide support.
Gold price breaks the barrier of the $2000 figure on woes surrounding a banking crisis in the United States (US) while market players wait for the US Federal Reserve (Fed) decision about raising rates. After hitting a daily low of $1978.58, the XAU/USD exchanges hands at $2008.52, gaining more than 1%.
Risk aversion was one of the reasons behind the $25.00 gains in Gold. JP Morgan’s acquisition of First Republic Bank easied worries in the banking industry. However, fiscal policy, mainly the rise of the debt ceiling in the US, keeps investors nervous. The US Treasury Secretary Janet Yellen commented in a letter to the US Congress that the office would not meet all US government obligations by June 1.
Aside from this, the US economic agenda revealed that job openings fell for the third straight month in March, though they remained at steady levels. The US Department of Labor (DoL) announced the JOLTs report, which came at 9.590 million, below the 9.775 million estimated by analysts.
In other data, Factory Orders for March jumped to 0.9%, above estimates of 0.8% and better than February’s contraction of 1.1%. Despite Monday’s ISM Manufacturing PMI report in contractionary territory, orders improved.
Additionally, XAU/USD found a bid, sponsored by lower US Treasury bond yields, across the board. US 2-year T-note yields are plunging 20 bps at 3.935%, while the 10-year benchmark note rate yields 3.431%, plummeting 14 bps.
Meanwhile, the Federal Reserve Open Market Committee (FOMC) two-day meeting begins today. The swaps markets, as shown by the CME FedWatch Tool, with traders expecting an 81.8% chance of a 25 bps rate hike to the Federal Funds Rate (FFR). Nevertheless, probabilities for a rate cut, uptick with investors estimating three 25 bps rate cuts by the year’s end.
Ahead of the week, XAU/USD traders await the FOMC’s decision, followed by Fed’s Chair Jerome Powell’s press conference at around 18:30 GMT.
The XAU/USD continued to trade sideways, but the jump above the 20-day EMA at $1990.12 exacerbated a test of the $2000 figure. The Relative Strength Index (RSI) oscillator tested the 50-midline but widened its distance, as it’s aiming up, while the Rate of Change (RoC) confirms that buyers are gathering momentum ahead of the FOMC’s decision. Upwards key resistance levels lie the April 5 high at $2032.13, followed by the YTD high at $2048.79. On the flip side, the $2000 will be the first line of defense for Gold buyers, followed by the 20-day EMA at around $1990.
Technical Levels: Supports and Resistances
XAUUSD currently trading at 2008.45 at the time of writing. Pair opened at 1982.54 and is trading with a change of 1.31 % .
| Overview | Overview.1 | |
|---|---|---|
| 0 | Today last price | 2008.45 |
| 1 | Today Daily Change | 25.91 |
| 2 | Today Daily Change % | 1.31 |
| 3 | Today daily open | 1982.54 |
The pair remains strongly bullish on the daily timeframe. It trades above its 20 SMA @ 2000.34, 50 SMA 1936.81, 100 SMA @ 1899.39 and 200 SMA @ 1808.69.
| Trends | Trends.1 | |
|---|---|---|
| 0 | Daily SMA20 | 2000.34 |
| 1 | Daily SMA50 | 1936.81 |
| 2 | Daily SMA100 | 1899.39 |
| 3 | Daily SMA200 | 1808.69 |
The previous day high was 2006.06 while the previous day low was 1977.12. The daily 38.2% Fib levels comes at 1988.18, expected to provide support. Similarly, the daily 61.8% fib level is at 1995.0, expected to provide support.
Note the levels of interest below:
- Pivot support is noted at 1971.09, 1959.63, 1942.15
- Pivot resistance is noted at 2000.03, 2017.51, 2028.97
| Levels | Levels.1 |
|---|---|
| Previous Daily High | 2006.06 |
| Previous Daily Low | 1977.12 |
| Previous Weekly High | 2009.41 |
| Previous Weekly Low | 1974.13 |
| Previous Monthly High | 2048.75 |
| Previous Monthly Low | 1949.83 |
| Daily Fibonacci 38.2% | 1988.18 |
| Daily Fibonacci 61.8% | 1995.00 |
| Daily Pivot Point S1 | 1971.09 |
| Daily Pivot Point S2 | 1959.63 |
| Daily Pivot Point S3 | 1942.15 |
| Daily Pivot Point R1 | 2000.03 |
| Daily Pivot Point R2 | 2017.51 |
| Daily Pivot Point R3 | 2028.97 |
[/s2If]
Nehcap Expert Advisor
The NEHCAP MT4 EA is high quality professional trading system geared to generate returns without using GRID or martingales. Each trade has strict risk per trade parameter. The pairs under management include EURUSD, GBPUSD, AUDCAD, AUDNZD,GBPAUD, EURAUD, EURCAD, CHFJPY and many more.
The system is trading live: LIVE ACCOUNT TRACKING
You can run it free. Apply for a free trial and track our account. Buy the system or use profit share mechanism to generate returns on your MT4.
Join Our Telegram Group


