#USDJPY @ 137.455 edges lower on Tuesday, albeit lacks any follow-through selling. (Pivot Orderbook analysis)
…
This is a premium post.
[s2If !current_user_can(access_s2member_level4)]Please register for FREE REGISTER to read full post below containing analysis. In case of any error or you think you are not able to read the full post below, please email us at support#nehcap.com [lwa][/s2If] [s2If current_user_can(access_s2member_level1)]
- USD/JPY edges lower on Tuesday, albeit lacks any follow-through selling.
- A softer risk tone underpins the JPY and acts as a headwind for the pair.
- The Fed-BoJ policy divergence lends support and helps limit the downside.
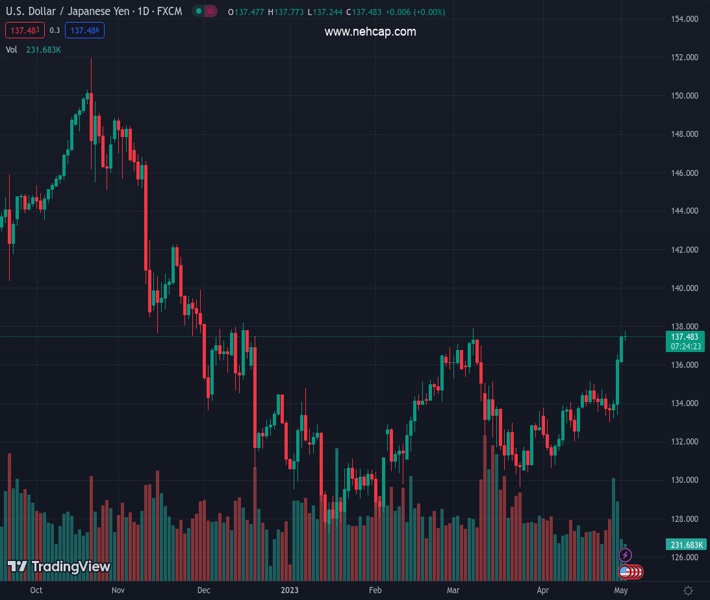
The pair currently trades last at 137.455.
The previous day high was 137.54 while the previous day low was 136.18. The daily 38.2% Fib levels comes at 137.02, expected to provide support. Similarly, the daily 61.8% fib level is at 136.7, expected to provide support.
The USD/JPY pair pulls back from a nearly two-month high, around the 137.75-137.80 region touched earlier this Tuesday and remains on the defensive heading into the North American session. The pair is currently placed just below the mid-137.00s, down less than 0.10% for the day, and seems poised to prolong its recent appreciating move.
A softer risk tone drives some haven flows towards the Japanese Yen (JPY) and is seen as a key factor exerting some downward pressure on the USD/JPY pair amid subdued US Dollar (USD) price action. In fact, the USD Index (DXY), which tracks the Greenback against a basket of currencies, struggles to capitalize on its intraday uptick to a two-week high touched on Tuesday. A fresh leg down in the US Treasury bond yields, dragged down by expectations that the Federal Reserve (Fed) will signal a pause in its policy-tightening cycle, acts as a headwind for the buck.
The markets, however, have fully priced in another 25 bps rate hike at the end of the two-day policy meeting on Wednesday. Moreover, the US ISM report released on Monday showed that there was a build-up of inflation pressures last month data kept alive the possibility of a further hike in June and continue to lend support to the Greenback. This marks a big divergence in comparison to the Bank of Japan’s (BoJ) dovish stance, which supports prospects for the emergence of some dip-buying around the USD/JPY pair and should help limit the downside.
Even from a technical perspective, the overnight sustained move and close above the very important 200-day Simple Moving Average (SMA) add credence to the near-term positive outlook. Bullish traders, however, might refrain from placing aggressive bets ahead of the highly-anticipated FOMC monetary policy decision on Wednesday. The focus will then shift to the release of the closely-watched US monthly employment details, popularly known as the NFP report on Friday, which should help determine the near-term trajectory for the USD/JPY pair.
Technical Levels: Supports and Resistances
USDJPY currently trading at 137.36 at the time of writing. Pair opened at 137.5 and is trading with a change of -0.1 % .
| Overview | Overview.1 | |
|---|---|---|
| 0 | Today last price | 137.36 |
| 1 | Today Daily Change | -0.14 |
| 2 | Today Daily Change % | -0.10 |
| 3 | Today daily open | 137.50 |
The pair remains strongly bullish on the daily timeframe. It trades above its 20 SMA @ 133.74, 50 SMA 133.89, 100 SMA @ 132.89 and 200 SMA @ 136.99.
| Trends | Trends.1 | |
|---|---|---|
| 0 | Daily SMA20 | 133.74 |
| 1 | Daily SMA50 | 133.89 |
| 2 | Daily SMA100 | 132.89 |
| 3 | Daily SMA200 | 136.99 |
The previous day high was 137.54 while the previous day low was 136.18. The daily 38.2% Fib levels comes at 137.02, expected to provide support. Similarly, the daily 61.8% fib level is at 136.7, expected to provide support.
Note the levels of interest below:
- Pivot support is noted at 136.6, 135.71, 135.24
- Pivot resistance is noted at 137.96, 138.43, 139.32
| Levels | Levels.1 |
|---|---|
| Previous Daily High | 137.54 |
| Previous Daily Low | 136.18 |
| Previous Weekly High | 136.56 |
| Previous Weekly Low | 133.01 |
| Previous Monthly High | 136.56 |
| Previous Monthly Low | 130.63 |
| Daily Fibonacci 38.2% | 137.02 |
| Daily Fibonacci 61.8% | 136.70 |
| Daily Pivot Point S1 | 136.60 |
| Daily Pivot Point S2 | 135.71 |
| Daily Pivot Point S3 | 135.24 |
| Daily Pivot Point R1 | 137.96 |
| Daily Pivot Point R2 | 138.43 |
| Daily Pivot Point R3 | 139.32 |
[/s2If]
Nehcap Expert Advisor
The NEHCAP MT4 EA is high quality professional trading system geared to generate returns without using GRID or martingales. Each trade has strict risk per trade parameter. The pairs under management include EURUSD, GBPUSD, AUDCAD, AUDNZD,GBPAUD, EURAUD, EURCAD, CHFJPY and many more.
The system is trading live: LIVE ACCOUNT TRACKING
You can run it free. Apply for a free trial and track our account. Buy the system or use profit share mechanism to generate returns on your MT4.
Join Our Telegram Group


