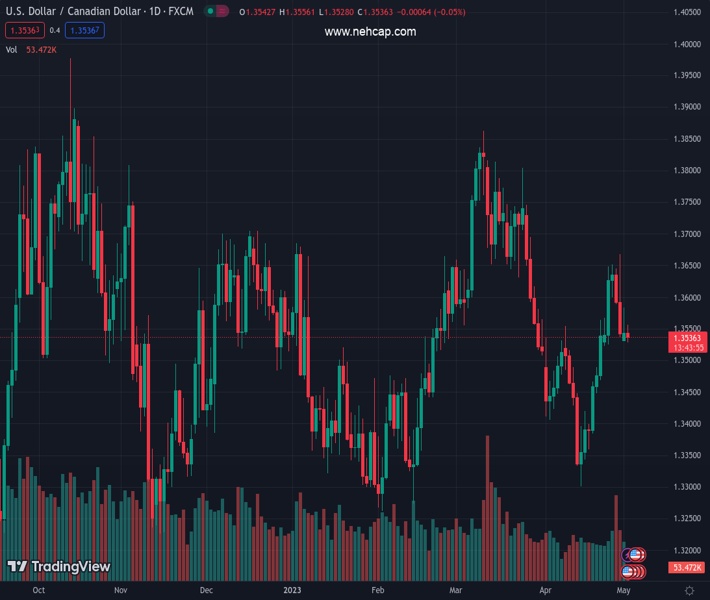
#USDCAD @ 1.35376 oscillates in a range and is influenced by a combination of diverging forces. (Pivot Orderbook analysis)
…
This is a premium post.
[s2If !current_user_can(access_s2member_level4)]Please register for FREE REGISTER to read full post below containing analysis. In case of any error or you think you are not able to read the full post below, please email us at support#nehcap.com [lwa][/s2If] [s2If current_user_can(access_s2member_level1)]
- USD/CAD oscillates in a range and is influenced by a combination of diverging forces.
- Weaker Crude Oil prices undermine the Loonie and continue to lend support to the pair.
- A modest USD downtick might hold back bulls from placing fresh bets and cap the upside.
The pair currently trades last at 1.35376.
The previous day high was 1.3583 while the previous day low was 1.353. The daily 38.2% Fib levels comes at 1.355, expected to provide resistance. Similarly, the daily 61.8% fib level is at 1.3563, expected to provide resistance.
The USD/CAD pair once again finds support near the 100-day Simple Moving Average (SMA) and attracts some buyers near the 1.3530-1.3525 region, or a one-week low touched this Tuesday, though lacks follow-through. Spot prices seesaw between tepid gains/minor losses through the early European session and currently trade around the 1.3535-1.3540 region, nearly unchanged for the day.
Crude Oil prices remain depressed amid worries that a deeper global economic downturn will dent fuel consumption, which, in turn, weighs on the commodity-linked Loonie and acts as a tailwind for the USD/CAD pair. That said, a modest US Dollar (USD) weakness might hold back bulls from placing aggressive bets and act as a headwind for the major, warranting some caution for aggressive bulls.
The USD downtick comes amid the uncertainty over the Federal Reserve’s (Fed) rate-hike path. In fact, the markets have fully priced in another 25 bps lift-off at the end of the two-day FOMC meeting on Wednesday and expect the US central bank to pause its rate-hiking cycle beyond May. That said, the incoming US data keeps alive the possibility of a further hike in June and lends support to the buck.
Hence, the market focus will remain glued to the highly-anticipated FOMC policy decision, scheduled to be announced during the US session on Wednesday. Nevertheless, the aforementioned mixed fundamental backdrop makes it prudent to wait for strong follow-through buying before confirming that the USD/CAD pair’s recent pullback from a one-month high touched last Friday has run its course.
Investors will then look to the closely-watched US monthly employment details, popularly known as the NFP report on Friday. Ahead of the key central bank event risk and the US macro data, traders on Tuesday will take cues from the US JOLTS Job Openings data. Apart from this, the US bond yields will drive the USD, which, along with Oil price dynamics, should provide some impetus to the USD/CAD pair.
Technical Levels: Supports and Resistances
USDCAD currently trading at 1.3539 at the time of writing. Pair opened at 1.3543 and is trading with a change of -0.03 % .
| Overview | Overview.1 | |
|---|---|---|
| 0 | Today last price | 1.3539 |
| 1 | Today Daily Change | -0.0004 |
| 2 | Today Daily Change % | -0.0300 |
| 3 | Today daily open | 1.3543 |
The pair is trading above its 20 Daily moving average @ 1.3489, below its 50 Daily moving average @ 1.3587 , above its 100 Daily moving average @ 1.3527 and above its 200 Daily moving average @ 1.3432
| Trends | Trends.1 | |
|---|---|---|
| 0 | Daily SMA20 | 1.3489 |
| 1 | Daily SMA50 | 1.3587 |
| 2 | Daily SMA100 | 1.3527 |
| 3 | Daily SMA200 | 1.3432 |
The previous day high was 1.3583 while the previous day low was 1.353. The daily 38.2% Fib levels comes at 1.355, expected to provide resistance. Similarly, the daily 61.8% fib level is at 1.3563, expected to provide resistance.
Note the levels of interest below:
- Pivot support is noted at 1.3521, 1.3499, 1.3468
- Pivot resistance is noted at 1.3574, 1.3605, 1.3627
| Levels | Levels.1 |
|---|---|
| Previous Daily High | 1.3583 |
| Previous Daily Low | 1.3530 |
| Previous Weekly High | 1.3668 |
| Previous Weekly Low | 1.3523 |
| Previous Monthly High | 1.3668 |
| Previous Monthly Low | 1.3301 |
| Daily Fibonacci 38.2% | 1.3550 |
| Daily Fibonacci 61.8% | 1.3563 |
| Daily Pivot Point S1 | 1.3521 |
| Daily Pivot Point S2 | 1.3499 |
| Daily Pivot Point S3 | 1.3468 |
| Daily Pivot Point R1 | 1.3574 |
| Daily Pivot Point R2 | 1.3605 |
| Daily Pivot Point R3 | 1.3627 |
[/s2If]
Nehcap Expert Advisor
The NEHCAP MT4 EA is high quality professional trading system geared to generate returns without using GRID or martingales. Each trade has strict risk per trade parameter. The pairs under management include EURUSD, GBPUSD, AUDCAD, AUDNZD,GBPAUD, EURAUD, EURCAD, CHFJPY and many more.
The system is trading live: LIVE ACCOUNT TRACKING
You can run it free. Apply for a free trial and track our account. Buy the system or use profit share mechanism to generate returns on your MT4.
Join Our Telegram Group


