#GBPUSD @ 1.24968 pares the previous day’s losses, the first in four, with mild gains. (Pivot Orderbook analysis)
…
This is a premium post.
[s2If !current_user_can(access_s2member_level4)]Please register for FREE REGISTER to read full post below containing analysis. In case of any error or you think you are not able to read the full post below, please email us at support#nehcap.com [lwa][/s2If] [s2If current_user_can(access_s2member_level1)]
- GBP/USD pares the previous day’s losses, the first in four, with mild gains.
- UK retailers post biggest increase in Food prices since 2005, sees easing inflation ahead.
- US Dollar retreats as debt ceiling concerns join pre-data anxiety amid full markets.
- UK Manufacturing PMI, US Factory Orders can direct intraday moves.
The pair currently trades last at 1.24968.
The previous day high was 1.2571 while the previous day low was 1.2481. The daily 38.2% Fib levels comes at 1.2515, expected to provide resistance. Similarly, the daily 61.8% fib level is at 1.2536, expected to provide resistance.
GBP/USD licks its wounds around 1.2500 after posting the biggest daily loss in a week, as well as snapping a three-day uptrend the previous day. In doing so, the Cable pair takes clues from the US Dollar’s retreat while cheering mostly upbeat inflation signals from the UK. However, comparatively more hawkish concerns surrounding the Fed, than the Bank of England (BoE), keep the Cable pair sellers hopeful as it lacks upside momentum near the highest levels in 11 months marked the previous day.
Food prices at British supermarkets rose 15.7% in the year to April, the biggest annual increase in records going back to 2005, but lower prices are on the horizon, the British Retail Consortium (BRC) said on Tuesday per Reuters.
On the other hand, the US Dollar Index (DXY) prints the first daily loss in four around 102.00 as US default fears loom after the Treasury Department bought forward the date of running out of funds to match obligations if the current debt ceiling isn’t altered, to June 01 from previously signaled July. It’s worth noting that a relief from the US First Republic Bank drama, after the US regulators seized assets of a troubled bank and sold them to a new buyer, namely JP Morgan, also weigh on the US Dollar and allow the GBP/USD buyers to return.
It should be noted, however, that the recently upbeat US inflation clues and easing hopes of Fed policy pivot in 2023 seem to keep the US Dollar buyers hopeful. Furthermore, fears surrounding the US-China tension and comparatively stronger US jobs report add strength to the bearish bias about the Cable pair.
Amid these plays, S&P 500 Futures track Wall Street’s indecisiveness near 4,180, retreating from a three-month high, whereas the US 10-year and two-year Treasury bond yields ease from a one-week high to 3.55% and 4.13% at the latest.
Moving on, GBP/USD pair traders should pay attention to the final readings of the UK S&P Global Manufacturing PMI for April, as well as the US Factory Orders for March, for intraday directions. However, major attention will be given to this week’s Federal Reserve (Fed) monetary policy meeting and the US jobs report for April.
Although the 10-DMA level of around 1.2475 puts a floor under the GBP/USD prices for short-term the Cable pair’s rebound remains elusive unless crossing a one-month-old ascending resistance line, close to 1.2575 at the latest.
Technical Levels: Supports and Resistances
GBPUSD currently trading at 1.2502 at the time of writing. Pair opened at 1.2496 and is trading with a change of 0.05% % .
| Overview | Overview.1 | |
|---|---|---|
| 0 | Today last price | 1.2502 |
| 1 | Today Daily Change | 0.0006 |
| 2 | Today Daily Change % | 0.05% |
| 3 | Today daily open | 1.2496 |
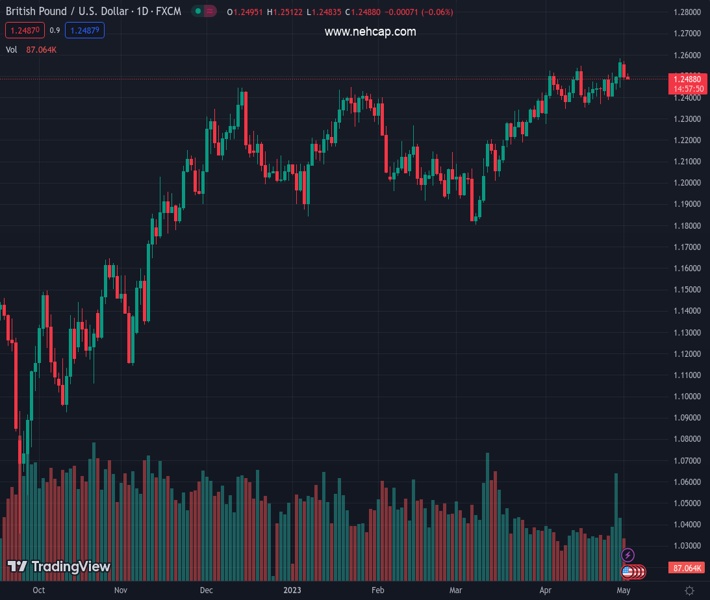
The pair remains strongly bullish on the daily timeframe. It trades above its 20 SMA @ 1.2455, 50 SMA 1.226, 100 SMA @ 1.2214 and 200 SMA @ 1.1942.
| Trends | Trends.1 | |
|---|---|---|
| 0 | Daily SMA20 | 1.2455 |
| 1 | Daily SMA50 | 1.2260 |
| 2 | Daily SMA100 | 1.2214 |
| 3 | Daily SMA200 | 1.1942 |
The previous day high was 1.2571 while the previous day low was 1.2481. The daily 38.2% Fib levels comes at 1.2515, expected to provide resistance. Similarly, the daily 61.8% fib level is at 1.2536, expected to provide resistance.
Note the levels of interest below:
- Pivot support is noted at 1.2461, 1.2426, 1.2371
- Pivot resistance is noted at 1.2551, 1.2606, 1.2642
| Levels | Levels.1 |
|---|---|
| Previous Daily High | 1.2571 |
| Previous Daily Low | 1.2481 |
| Previous Weekly High | 1.2584 |
| Previous Weekly Low | 1.2387 |
| Previous Monthly High | 1.2584 |
| Previous Monthly Low | 1.2275 |
| Daily Fibonacci 38.2% | 1.2515 |
| Daily Fibonacci 61.8% | 1.2536 |
| Daily Pivot Point S1 | 1.2461 |
| Daily Pivot Point S2 | 1.2426 |
| Daily Pivot Point S3 | 1.2371 |
| Daily Pivot Point R1 | 1.2551 |
| Daily Pivot Point R2 | 1.2606 |
| Daily Pivot Point R3 | 1.2642 |
[/s2If]
Nehcap Expert Advisor
The NEHCAP MT4 EA is high quality professional trading system geared to generate returns without using GRID or martingales. Each trade has strict risk per trade parameter. The pairs under management include EURUSD, GBPUSD, AUDCAD, AUDNZD,GBPAUD, EURAUD, EURCAD, CHFJPY and many more.
The system is trading live: LIVE ACCOUNT TRACKING
You can run it free. Apply for a free trial and track our account. Buy the system or use profit share mechanism to generate returns on your MT4.
Join Our Telegram Group


