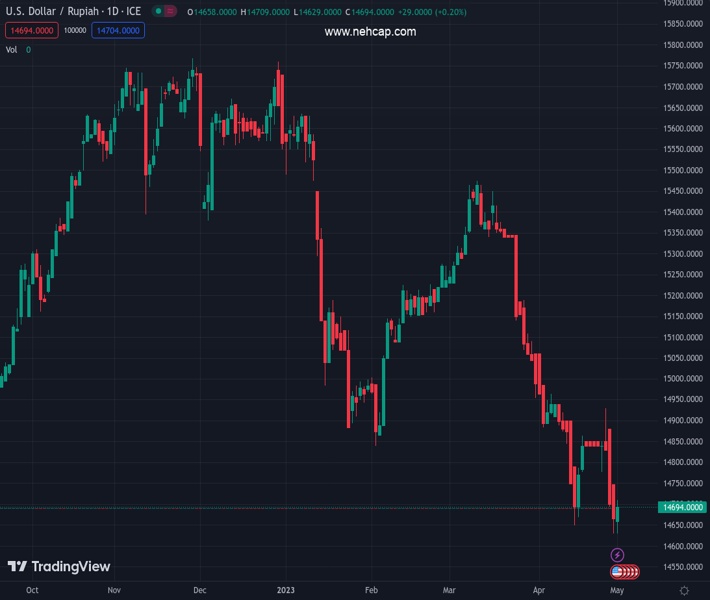
#USDIDR @ 14,695.0 picks up bids to snap eight-day downtrend, recovers from the lowest levels since June 2022. (Pivot Orderbook analysis)
…
This is a premium post.
[s2If !current_user_can(access_s2member_level4)]Please register for FREE REGISTER to read full post below containing analysis. In case of any error or you think you are not able to read the full post below, please email us at support#nehcap.com [lwa][/s2If] [s2If current_user_can(access_s2member_level1)]
- USD/IDR picks up bids to snap eight-day downtrend, recovers from the lowest levels since June 2022.
- Indonesian Inflation, Core Inflation eased in April despite staying beyond 2% to 4% range.
- Cautious optimism in Asia-Pacific zone fails to please Indonesia Rupiah buyers.
- Second-tier US data can entertain USD/IDR traders ahead of Fed, NFP.
The pair currently trades last at 14695.0.
The previous day high was 14683.0 while the previous day low was 14638.0. The daily 38.2% Fib levels comes at 14665.81, expected to provide support. Similarly, the daily 61.8% fib level is at 14655.19, expected to provide support.
USD/IDR justifies downbeat Indonesia inflation while bouncing off an 11-month low to 14,710 heading into Tuesday’s European session. In doing so, the Indonesia Rupiah pair fails to cheer a retreat in the US Dollar prices amid a sluggish session due to the mixed sentiment and anxiety ahead of the key data/events.
Indonesia’s headline Inflation eased to 4.33% YoY in April from 4.97% prior and 4.39% market forecasts while the monthly inflation figures came in mixed to 0.33% versus 0.37% expected and 0.18% prior. Further, the Core Inflation eased to 2.83% during the stated month from 2.89% analysts’ estimation and 2.94% prior.
Reuters released Statistics Indonesia chief Margo Yuwono’s comments after the Inflation data as saying, “Higher transportation fares and prices of fuel and some food commodities around the Islamic holy month of Ramadan contributed to April’s inflation,” the policymaker also added, “although the increase was more benign than the Ramadan month in previous years.”
Elsewhere, markets in the Asia-Pacific region remain cautiously optimistic after the International Monetary Fund (IMF) anticipated them to be the most dynamic of the world’s major regions in 2023, per the latest reports.
It should be noted, however, that talks surrounding the US default seem to challenge the market’s previously US Dollar positive bias. That said, US Treasury Department renewed fears of US default by pulling forward the date of running out of funds to match obligations if the current debt ceiling isn’t altered, to June 01 from previously signaled July.
On the other hand, relief from the US First Republic Bank issue allowed traders to take a breather as the US regulators seized assets of the First Republic Bank and sold them to a new buyer, namely JP Morgan. The same could be held responsible for the USD/IDR pair’s hesitance in rallying much. Furthermore, Axios came out with headlines suggesting the US allies’ preparations for the US-China war over Taiwan, which in turn keeps the Euro bears hopeful, via the US Dollar’s haven demand.
Moving on, the US Factory Orders for March, expected to rise by 0.8% MoM versus -0.7% prior, may entertain USD/IDR traders ahead of this week’s Federal Reserve (Fed) monetary policy meeting and the US jobs report for April.
USD/IDR recovers from a lower line of the two-month-old descending triangle, currently near 14,615, backed by the oversold RSI (14) line. The recovery moves, however, need validation from the stated triangle’s top line, close to 14,885 at the latest, to convince the pair buyers.
Technical Levels: Supports and Resistances
USDIDR currently trading at 14701 at the time of writing. Pair opened at 14675.05 and is trading with a change of 0.18% % .
| Overview | Overview.1 | |
|---|---|---|
| 0 | Today last price | 14701 |
| 1 | Today Daily Change | 25.9500 |
| 2 | Today Daily Change % | 0.18% |
| 3 | Today daily open | 14675.05 |
The pair remains strongly bearish on the daily time frame. It trades below the 20 SMA @ 14866.285, 50 SMA 15100.202, 100 SMA @ 15207.3535 and 200 SMA @ 15221.9965.
| Trends | Trends.1 | |
|---|---|---|
| 0 | Daily SMA20 | 14866.2850 |
| 1 | Daily SMA50 | 15100.2020 |
| 2 | Daily SMA100 | 15207.3535 |
| 3 | Daily SMA200 | 15221.9965 |
The previous day high was 14683.0 while the previous day low was 14638.0. The daily 38.2% Fib levels comes at 14665.81, expected to provide support. Similarly, the daily 61.8% fib level is at 14655.19, expected to provide support.
Note the levels of interest below:
- Pivot support is noted at 14647.7, 14620.35, 14602.7
- Pivot resistance is noted at 14692.7, 14710.35, 14737.7
| Levels | Levels.1 |
|---|---|
| Previous Daily High | 14683.00 |
| Previous Daily Low | 14638.00 |
| Previous Weekly High | 14985.35 |
| Previous Weekly Low | 14627.00 |
| Previous Monthly High | 15419.05 |
| Previous Monthly Low | 14627.00 |
| Daily Fibonacci 38.2% | 14665.81 |
| Daily Fibonacci 61.8% | 14655.19 |
| Daily Pivot Point S1 | 14647.70 |
| Daily Pivot Point S2 | 14620.35 |
| Daily Pivot Point S3 | 14602.70 |
| Daily Pivot Point R1 | 14692.70 |
| Daily Pivot Point R2 | 14710.35 |
| Daily Pivot Point R3 | 14737.70 |
[/s2If]
Nehcap Expert Advisor
The NEHCAP MT4 EA is high quality professional trading system geared to generate returns without using GRID or martingales. Each trade has strict risk per trade parameter. The pairs under management include EURUSD, GBPUSD, AUDCAD, AUDNZD,GBPAUD, EURAUD, EURCAD, CHFJPY and many more.
The system is trading live: LIVE ACCOUNT TRACKING
You can run it free. Apply for a free trial and track our account. Buy the system or use profit share mechanism to generate returns on your MT4.
Join Our Telegram Group


