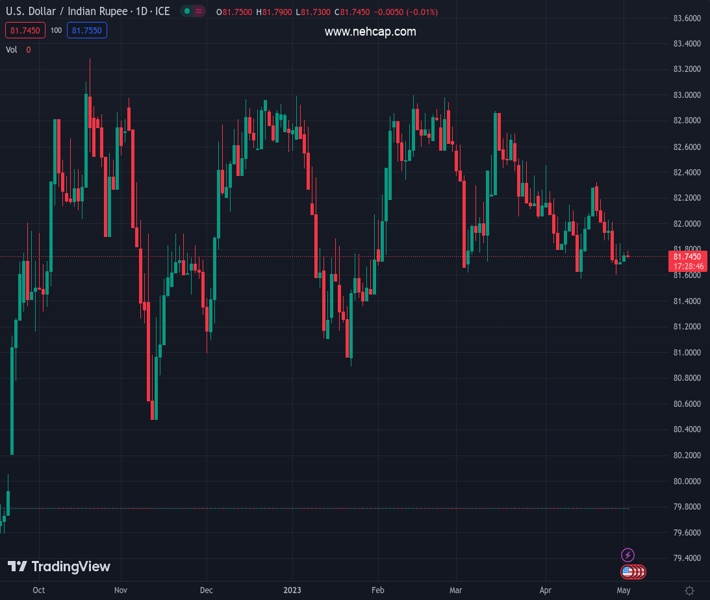
#USDINR @ 81.7510 remains pressured around intraday low, marks inactive daily performance. (Pivot Orderbook analysis)
…
This is a premium post.
[s2If !current_user_can(access_s2member_level4)]Please register for FREE REGISTER to read full post below containing analysis. In case of any error or you think you are not able to read the full post below, please email us at support#nehcap.com [lwa][/s2If] [s2If current_user_can(access_s2member_level1)]
- USD/INR remains pressured around intraday low, marks inactive daily performance.
- IMF says India, China to lead Asia-Pacific growth in its latest report.
- Fears of US default, return of full markets weigh on US Dollar and favor Indian Rupee buyers.
- US Factory Orders can entertain intraday traders ahead of Fed, NFP.
The pair currently trades last at 81.7510.
The previous day high was 81.934 while the previous day low was 81.7054. The daily 38.2% Fib levels comes at 81.7927, expected to provide resistance. Similarly, the daily 61.8% fib level is at 81.8467, expected to provide resistance.
USD/INR treads water around 81.75, recently depressed, as market players seek more clues to cheer the International Monetary Fund’s (IMF) upbeat economic analysis for India and China during early Tuesday. In doing so, the Indian Rupee (INR) pair also pays little heed to the US Dollar’s retreat amid looming fears of default and the market’s anxiety as traders return from a long weekend.
“Asia and Pacific will be the most dynamic of the world’s major regions in 2023, predominantly driven by the buoyant outlook for China and India,” said the IMF in its latest report.
Also read: IMF raises Asia’s economic forecast on China recovery, warns of risks
On the other hand, talks surrounding the US default seem to challenge the market’s previously US Dollar positive bias. That said, US Treasury Department renewed fears of US default by pulling forward the date of running out of funds to match obligations if the current debt ceiling isn’t altered, to June 01 from previously signaled July. Following that, Reuters came out with the news suggesting the US Senate Majority Leader Chuck Schumer’s push for an expedited process to consider a clean two-year suspension of the federal debt ceiling. Further, chatters of US President Joe Biden’s call to four top US diplomats and arranging a meeting on May 09 also made rounds.
Furthermore, relief from the US First Republic Bank issue allowed traders to take a breather as the US regulators seized assets of the First Republic Bank and sold them to a new buyer, namely JP Morgan.
It’s worth noting that the latest statements from China Beige Book (CBB) suggesting that new data offer the first evidence of a truly robust 2023 recovery in the dragon nation, per analysts from CBB, also seem to favor the USD/INR bears. However, Axios came out with headlines suggesting the US allies’ preparations for the US-China war over Taiwan, which in turn keeps the Euro bears hopeful, via the US Dollar’s haven demand.
Amid these plays, S&P 500 Futures track Wall Street’s indecisiveness near 4,180, retreating from a three-month high, whereas the US 10-year and two-year Treasury bond yields ease from a one-week high to 3.55% and 4.13% at the latest.
Given the return of major markets, except for China, the USD/INR pair may witness a comparatively active trading session ahead. That said, the pair sellers, however, are likely to find hurdles should the risk appetite deteriorates. Also important to watch will be the US Factory Orders for March, expected to rise by 0.8% MoM versus -0.7% prior.
The previous day’s Doji candlestick joins the downbeat RSI (14) to keep the USD/INR buyers hopeful unless the quote breaks an upward-sloping support line from early November 2022, close to 81.65 by the press time.
Technical Levels: Supports and Resistances
USDINR currently trading at 81.7404 at the time of writing. Pair opened at 81.7416 and is trading with a change of -0.00% % .
| Overview | Overview.1 | |
|---|---|---|
| 0 | Today last price | 81.7404 |
| 1 | Today Daily Change | -0.0012 |
| 2 | Today Daily Change % | -0.00% |
| 3 | Today daily open | 81.7416 |
The pair is trading below its 20 Daily moving average @ 81.9357, below its 50 Daily moving average @ 82.192 , below its 100 Daily moving average @ 82.2231 and above its 200 Daily moving average @ 81.5835
| Trends | Trends.1 | |
|---|---|---|
| 0 | Daily SMA20 | 81.9357 |
| 1 | Daily SMA50 | 82.1920 |
| 2 | Daily SMA100 | 82.2231 |
| 3 | Daily SMA200 | 81.5835 |
The previous day high was 81.934 while the previous day low was 81.7054. The daily 38.2% Fib levels comes at 81.7927, expected to provide resistance. Similarly, the daily 61.8% fib level is at 81.8467, expected to provide resistance.
Note the levels of interest below:
- Pivot support is noted at 81.6533, 81.5651, 81.4247
- Pivot resistance is noted at 81.8819, 82.0223, 82.1105
| Levels | Levels.1 |
|---|---|
| Previous Daily High | 81.9340 |
| Previous Daily Low | 81.7054 |
| Previous Weekly High | 82.1614 |
| Previous Weekly Low | 81.4850 |
| Previous Monthly High | 82.5092 |
| Previous Monthly Low | 81.4850 |
| Daily Fibonacci 38.2% | 81.7927 |
| Daily Fibonacci 61.8% | 81.8467 |
| Daily Pivot Point S1 | 81.6533 |
| Daily Pivot Point S2 | 81.5651 |
| Daily Pivot Point S3 | 81.4247 |
| Daily Pivot Point R1 | 81.8819 |
| Daily Pivot Point R2 | 82.0223 |
| Daily Pivot Point R3 | 82.1105 |
[/s2If]
Nehcap Expert Advisor
The NEHCAP MT4 EA is high quality professional trading system geared to generate returns without using GRID or martingales. Each trade has strict risk per trade parameter. The pairs under management include EURUSD, GBPUSD, AUDCAD, AUDNZD,GBPAUD, EURAUD, EURCAD, CHFJPY and many more.
The system is trading live: LIVE ACCOUNT TRACKING
You can run it free. Apply for a free trial and track our account. Buy the system or use profit share mechanism to generate returns on your MT4.
Join Our Telegram Group


