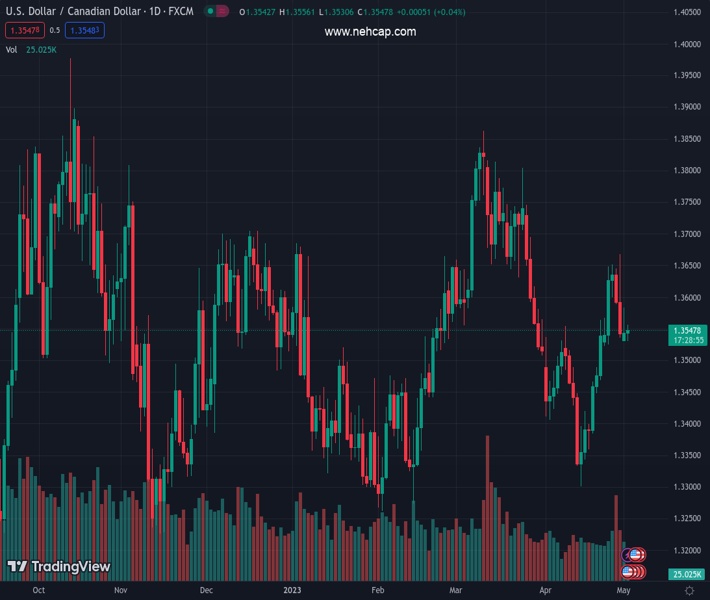
#USDCAD @ 1.35473 is consistently defending the 1.3540 support, however, a volatile action is anticipated ahead of Fed policy. (Pivot Orderbook analysis)
…
This is a premium post.
[s2If !current_user_can(access_s2member_level4)]Please register for FREE REGISTER to read full post below containing analysis. In case of any error or you think you are not able to read the full post below, please email us at support#nehcap.com [lwa][/s2If] [s2If current_user_can(access_s2member_level1)]
- USD/CAD is consistently defending the 1.3540 support, however, a volatile action is anticipated ahead of Fed policy.
- As a 25 bp rate hike by the Fed is already expected, uncertainty about Fed rate guidance is fueling anxiety among investors.
- The US Dollar has witnessed selling interest from 61.8% and 50% Fibo retracements at 1.3648 and 1.3584 respectively.
The pair currently trades last at 1.35473.
The previous day high was 1.3583 while the previous day low was 1.353. The daily 38.2% Fib levels comes at 1.355, expected to provide resistance. Similarly, the daily 61.8% fib level is at 1.3563, expected to provide resistance.
The USD/CAD pair has been oscillating in a narrow range around 1.3550 from the past two trading sessions. The Loonie asset is continuously defending its immediate support of 1.3540 amid overall strength in the US Dollar Index (DXY).
A power-pack action is anticipated from the asset as investors are awaiting Federal Reserve’s (Fed) monetary policy. A consecutive 25 basis point (bp) interest rate hike is widely anticipated, however, uncertainty over rate guidance is infusing anxiety among market participants.
The USD Index is facing barricades around 102.20 for the past two weeks. Meanwhile, S&P500 futures have trimmed some of their losses, showing some improvement in the risk appetite of the market participants.
USD/CAD is facing selling pressure from Fibonacci retracement like a textbook picture. On a two-hour scale, the Fibonacci retracement tool is placed from March 10 high at 1.3862 to April 14 low at 1.3301. The US Dollar has witnessed selling interest from 61.8% and 50% Fibo retracements at 1.3648 and 1.3584 respectively.
Also, the 20-period Exponential Moving Average (EMA) at 1.3560 is acting as a barricade for the US Dollar.
A slippage into the 20.00-40.00 tunnel by the Relative Strength Index (RSI) (14) will result in the activation of bearish momentum.
Going forward, a decisive break below the intraday low at 1.3533 will expose the asset to psychological support at 1.3500 followed by a 23.6% Fibo retracement at 1.3438.
On the flip side, a recovery move above the 61.8% Fibo retracement at 1.3650 will trigger a reversal and will drive the major toward the round-level resistance at 1.3700. A break above the same will expose the asset to March 22 high at 1.3745.
Technical Levels: Supports and Resistances
USDCAD currently trading at 1.3547 at the time of writing. Pair opened at 1.3543 and is trading with a change of 0.03 % .
| Overview | Overview.1 | |
|---|---|---|
| 0 | Today last price | 1.3547 |
| 1 | Today Daily Change | 0.0004 |
| 2 | Today Daily Change % | 0.0300 |
| 3 | Today daily open | 1.3543 |
The pair is trading above its 20 Daily moving average @ 1.3489, below its 50 Daily moving average @ 1.3587 , above its 100 Daily moving average @ 1.3527 and above its 200 Daily moving average @ 1.3432
| Trends | Trends.1 | |
|---|---|---|
| 0 | Daily SMA20 | 1.3489 |
| 1 | Daily SMA50 | 1.3587 |
| 2 | Daily SMA100 | 1.3527 |
| 3 | Daily SMA200 | 1.3432 |
The previous day high was 1.3583 while the previous day low was 1.353. The daily 38.2% Fib levels comes at 1.355, expected to provide resistance. Similarly, the daily 61.8% fib level is at 1.3563, expected to provide resistance.
Note the levels of interest below:
- Pivot support is noted at 1.3521, 1.3499, 1.3468
- Pivot resistance is noted at 1.3574, 1.3605, 1.3627
| Levels | Levels.1 |
|---|---|
| Previous Daily High | 1.3583 |
| Previous Daily Low | 1.3530 |
| Previous Weekly High | 1.3668 |
| Previous Weekly Low | 1.3523 |
| Previous Monthly High | 1.3668 |
| Previous Monthly Low | 1.3301 |
| Daily Fibonacci 38.2% | 1.3550 |
| Daily Fibonacci 61.8% | 1.3563 |
| Daily Pivot Point S1 | 1.3521 |
| Daily Pivot Point S2 | 1.3499 |
| Daily Pivot Point S3 | 1.3468 |
| Daily Pivot Point R1 | 1.3574 |
| Daily Pivot Point R2 | 1.3605 |
| Daily Pivot Point R3 | 1.3627 |
[/s2If]
Nehcap Expert Advisor
The NEHCAP MT4 EA is high quality professional trading system geared to generate returns without using GRID or martingales. Each trade has strict risk per trade parameter. The pairs under management include EURUSD, GBPUSD, AUDCAD, AUDNZD,GBPAUD, EURAUD, EURCAD, CHFJPY and many more.
The system is trading live: LIVE ACCOUNT TRACKING
You can run it free. Apply for a free trial and track our account. Buy the system or use profit share mechanism to generate returns on your MT4.
Join Our Telegram Group


