#XAUUSD @ 1,982.79 Gold price remains sluggish ahead of the key United States data, events., @nehcap view: Further downside expected (Pivot Orderbook analysis)
…
This is a premium post.
[s2If !current_user_can(access_s2member_level4)]Please register for FREE REGISTER to read full post below containing analysis. In case of any error or you think you are not able to read the full post below, please email us at support#nehcap.com [lwa][/s2If] [s2If current_user_can(access_s2member_level1)]
- Gold price remains sluggish ahead of the key United States data, events.
- First Republic Bank-induced relief contrasts with fears of US debt ceiling expiry to prod XAU/USD bulls.
- Mixed US PMIs, holidays in major markets offered softer start to a critical week.
- Federal Reserve’s hawkish bias, upbeat US Nonfarm Payrolls become necessary to convince the Gold sellers.
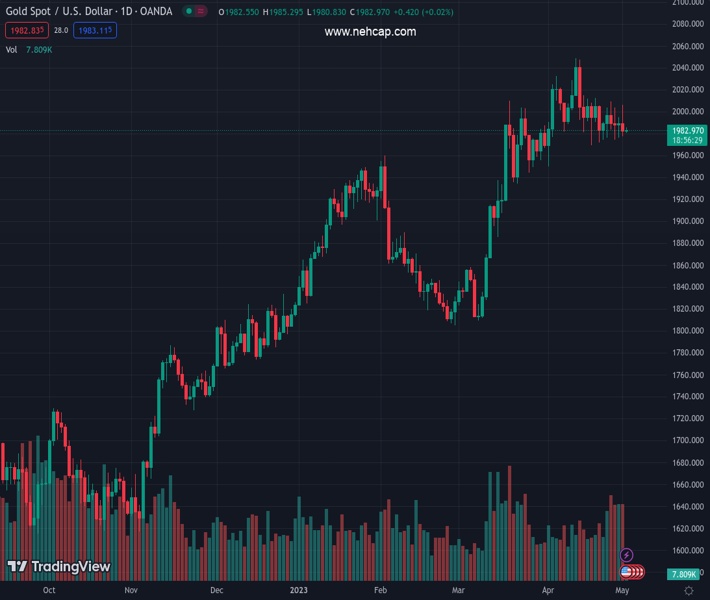
The pair currently trades last at 1982.79.
The previous day high was 2006.06 while the previous day low was 1977.12. The daily 38.2% Fib levels comes at 1988.18, expected to provide resistance. Similarly, the daily 61.8% fib level is at 1995.0, expected to provide resistance.
Gold price (XAU/USD) aptly portrays the market’s cautious mood around $1,980, after a downbeat week-start, as full markets return on Tuesday. In doing so, the XAU/USD justifies mixed plays surrounding the US debt ceiling expiration and First Republic Bank, as well as the hawkish concerns about the Federal Reserve (Fed). However, the recently firmer US inflation expectations and data keep the Gold bears hopeful ahead of a busy week.
Gold price manages to strike a balance between the market’s fears of the US debt ceiling expiration and the sigh of relief after the First Republic Bank’s takeover by JP Morgan.
That said, Reuters came out with the news suggesting the US Senate Majority Leader Chuck Schumer’s push for an expedited process to consider a clean two-year suspension of the federal debt ceiling. Fueling the US diplomat’s move is the Treasury Department’s recent updates of the default by pulling forward the date of running out of funds to match obligations if the current debt ceiling isn’t altered by June 01, previously signaled as July. “US Treasury Secretary Janet Yellen said in a letter to Congress that the agency may be unable to meet all of its debt obligations as soon as June 1 if the debt ceiling is not raised, putting new urgency on talks in Congress,” said Reuters.
The same triggered chatters of US President Joe Biden’s call to four top US diplomats and arranging a meeting on May 09 made rounds. Further, US House of Representatives Speaker Kevin McCarthy mentioned that there is a bill sitting in the Senate as we speak that would put the risk of default to rest.
On the other hand, the US regulators seized assets of the First Republic Bank and sold them to a new buyer, namely JP Morgan. “JPMorgan will pay $10.6 billion to the U.S. Federal Deposit Insurance Corp (FDIC) as part of the deal to take control of most of the San Francisco-based bank’s assets and get access to First Republic’s coveted wealthy client base,” said Reuters.
With this, the market sentiment dwindles amid mixed concerns and challenges to the Gold price. While portraying the mood, the S&P 500 Futures print mild losses despite Wall Street’s upbeat close whereas the US Treasury bond yields and the US Dollar Index retreat.
While the risk catalysts do challenge the Gold price, the latest prints of the US data and inflation precursors keep the bearish bias surrounding the XAU/USD intact.
Friday’s upbeat US inflation clues via Core PCE Price Index join Monday’s mostly firmer US PMI data to underpin hawkish bias about the Federal Reserve (Fed) and weigh on the Gold price.
On Monday, US ISM Manufacturing PMI improved to 47.1 for April versus 46.3 prior and 46.6 market forecasts while the S&P Global Manufacturing PMI for the said month eased to 50.2 versus 50.4 first estimations. Further, US inflation expectations, as per the 10-year and 5-year breakeven inflation rates from the St. Louis Federal Reserve (FRED) data, justify the market’s latest reassessment of the Federal Reserve (Fed) concerns by bouncing off a six-week low on Monday.
Looking forward, US Factory Orders for March, expected to rise by 0.8% MoM versus -0.7% prior, can offer immediate directions to the Gold price. However, major attention will be given to Wednesday’s US Federal Reserve (Fed) monetary policy announcements and Friday’s jobs report for April for a clear guide.
Gold price remains sidelined within a $30.00 trading range comprising a two-week-old descending resistance line and an upward-sloping support line from March 21, respectively near $2,006 and $1,977.
It’s worth observing that the XAU/USD’s repeated failure to cross the 21-DMA hurdle, around the $2,000 round figure, joins the previous week’s Doji candlesticks to suggest the Gold’s bullish exhaustion, which in turn hints at the downside break of $1,979 support.
Additionally luring the XAU/USD sellers are the bearish signals from the Moving Average Convergence and Divergence (MACD) indicator and steady Relative Strength Index (RSI) line, placed at 14.
However, the Gold price weakness below $1,979 needs validation from the 50-DMA support of near $1,939 to convince XAU/USD bears.
On the contrary, an upside clearance of the $2,006 hurdle has multiple resistances near $2,010 and $2,030 levels before the latest peak of around $2,049 can lure the Gold buyers.
Overall, Gold buyers are running out of steam but the sellers need validation from $1,936.
Trend: Further downside expected
Technical Levels: Supports and Resistances
XAUUSD currently trading at 1983.27 at the time of writing. Pair opened at 1982.54 and is trading with a change of 0.04% % .
| Overview | Overview.1 | |
|---|---|---|
| 0 | Today last price | 1983.27 |
| 1 | Today Daily Change | 0.73 |
| 2 | Today Daily Change % | 0.04% |
| 3 | Today daily open | 1982.54 |
The pair is trading below its 20 Daily moving average @ 2000.34, above its 50 Daily moving average @ 1936.81 , above its 100 Daily moving average @ 1899.39 and above its 200 Daily moving average @ 1808.69
| Trends | Trends.1 | |
|---|---|---|
| 0 | Daily SMA20 | 2000.34 |
| 1 | Daily SMA50 | 1936.81 |
| 2 | Daily SMA100 | 1899.39 |
| 3 | Daily SMA200 | 1808.69 |
The previous day high was 2006.06 while the previous day low was 1977.12. The daily 38.2% Fib levels comes at 1988.18, expected to provide resistance. Similarly, the daily 61.8% fib level is at 1995.0, expected to provide resistance.
Note the levels of interest below:
- Pivot support is noted at 1971.09, 1959.63, 1942.15
- Pivot resistance is noted at 2000.03, 2017.51, 2028.97
| Levels | Levels.1 |
|---|---|
| Previous Daily High | 2006.06 |
| Previous Daily Low | 1977.12 |
| Previous Weekly High | 2009.41 |
| Previous Weekly Low | 1974.13 |
| Previous Monthly High | 2048.75 |
| Previous Monthly Low | 1949.83 |
| Daily Fibonacci 38.2% | 1988.18 |
| Daily Fibonacci 61.8% | 1995.00 |
| Daily Pivot Point S1 | 1971.09 |
| Daily Pivot Point S2 | 1959.63 |
| Daily Pivot Point S3 | 1942.15 |
| Daily Pivot Point R1 | 2000.03 |
| Daily Pivot Point R2 | 2017.51 |
| Daily Pivot Point R3 | 2028.97 |
[/s2If]
Nehcap Expert Advisor
The NEHCAP MT4 EA is high quality professional trading system geared to generate returns without using GRID or martingales. Each trade has strict risk per trade parameter. The pairs under management include EURUSD, GBPUSD, AUDCAD, AUDNZD,GBPAUD, EURAUD, EURCAD, CHFJPY and many more.
The system is trading live: LIVE ACCOUNT TRACKING
You can run it free. Apply for a free trial and track our account. Buy the system or use profit share mechanism to generate returns on your MT4.
Join Our Telegram Group


