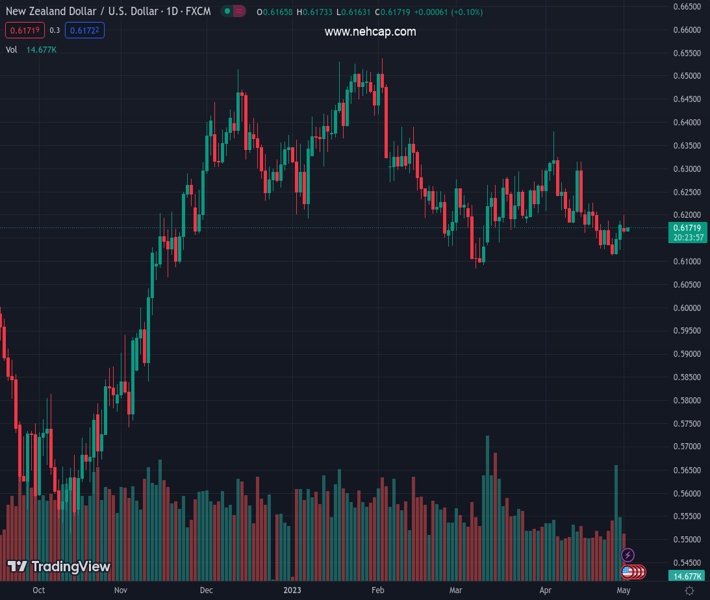
#NZDUSD @ 0.61717 has shown a decent recovery above 0.6170 as USD Index has sensed selling pressure. (Pivot Orderbook analysis)
…
This is a premium post.
[s2If !current_user_can(access_s2member_level4)]Please register for FREE REGISTER to read full post below containing analysis. In case of any error or you think you are not able to read the full post below, please email us at support#nehcap.com [lwa][/s2If] [s2If current_user_can(access_s2member_level1)]
- NZD/USD has shown a decent recovery above 0.6170 as USD Index has sensed selling pressure.
- As per the consensus, the US economy added 150K jobs in April lower than the former additions of 145K.
- NZD/USD is continuously facing pressure near the downward-sloping trendline plotted from 0.6386.
The pair currently trades last at 0.61717.
The previous day high was 0.6201 while the previous day low was 0.616. The daily 38.2% Fib levels comes at 0.6176, expected to provide resistance. Similarly, the daily 61.8% fib level is at 0.6185, expected to provide resistance.
The NZD/USD pair has scaled sharply above the immediate resistance of 0.6170 in the early Tokyo session. Earlier, the Kiwi asset witnessed an intense sell-off on Monday after failing to claim the round-level resistance of 0.6200.
The US Dollar Index (DXY) has sensed sheer selling pressure near its two-week-old resistance of 102.20. It seems that investors are digesting pre-Federal Reserve (Fed) policy anxiety.
Wednesday’s New Zealand and United States Employment data will be keenly watched. NZ’s Employment Change (Q1) is expected to remain steady at 0.2%. While the Unemployment Rate is seen rising to 3.5% from the former release of 3.4%.
On the US front, investors will keep an eye on Automatic Data Processing (ADP) Employment data. As per the consensus, the US economy added 150K jobs in April lower than the former additions of 145K.
NZD/USD is continuously facing pressure near the downward-sloping trendline plotted from April 05 high at 0.6386 on an hourly scale. The Kiwi asset has made a higher high after a lower high lower low structure, hinting for a potential bullish reversal ahead.
The New Zealand Dollar is facing immediate selling pressure near horizontal resistance placed from April 20 high at 0.6204.
Meanwhile, the Relative Strength Index (RSI) (14) has slipped back into the 40.00-60.00 range, indicating consolidation ahead.
Should the asset break above April 20 high at 0.6204, kiwi bulls will drive the asset towards April 19 high at 0.6227 followed by April 07 high at 0.6265.
In an alternate scenario, a breakdown of April 26 low at 0.6110 will drag the asset toward March 08 low at 0.6088 followed by the 15 Nov 2022 low at 0.6058.
Technical Levels: Supports and Resistances
NZDUSD currently trading at 0.6172 at the time of writing. Pair opened at 0.6166 and is trading with a change of 0.1 % .
| Overview | Overview.1 | |
|---|---|---|
| 0 | Today last price | 0.6172 |
| 1 | Today Daily Change | 0.0006 |
| 2 | Today Daily Change % | 0.1000 |
| 3 | Today daily open | 0.6166 |
The pair is trading below its 20 Daily moving average @ 0.6204, below its 50 Daily moving average @ 0.6207 , below its 100 Daily moving average @ 0.6285 and above its 200 Daily moving average @ 0.616
| Trends | Trends.1 | |
|---|---|---|
| 0 | Daily SMA20 | 0.6204 |
| 1 | Daily SMA50 | 0.6207 |
| 2 | Daily SMA100 | 0.6285 |
| 3 | Daily SMA200 | 0.6160 |
The previous day high was 0.6201 while the previous day low was 0.616. The daily 38.2% Fib levels comes at 0.6176, expected to provide resistance. Similarly, the daily 61.8% fib level is at 0.6185, expected to provide resistance.
Note the levels of interest below:
- Pivot support is noted at 0.615, 0.6135, 0.6109
- Pivot resistance is noted at 0.6191, 0.6217, 0.6232
| Levels | Levels.1 |
|---|---|
| Previous Daily High | 0.6201 |
| Previous Daily Low | 0.6160 |
| Previous Weekly High | 0.6189 |
| Previous Weekly Low | 0.6111 |
| Previous Monthly High | 0.6389 |
| Previous Monthly Low | 0.6111 |
| Daily Fibonacci 38.2% | 0.6176 |
| Daily Fibonacci 61.8% | 0.6185 |
| Daily Pivot Point S1 | 0.6150 |
| Daily Pivot Point S2 | 0.6135 |
| Daily Pivot Point S3 | 0.6109 |
| Daily Pivot Point R1 | 0.6191 |
| Daily Pivot Point R2 | 0.6217 |
| Daily Pivot Point R3 | 0.6232 |
[/s2If]
Nehcap Expert Advisor
The NEHCAP MT4 EA is high quality professional trading system geared to generate returns without using GRID or martingales. Each trade has strict risk per trade parameter. The pairs under management include EURUSD, GBPUSD, AUDCAD, AUDNZD,GBPAUD, EURAUD, EURCAD, CHFJPY and many more.
The system is trading live: LIVE ACCOUNT TRACKING
You can run it free. Apply for a free trial and track our account. Buy the system or use profit share mechanism to generate returns on your MT4.
Join Our Telegram Group


