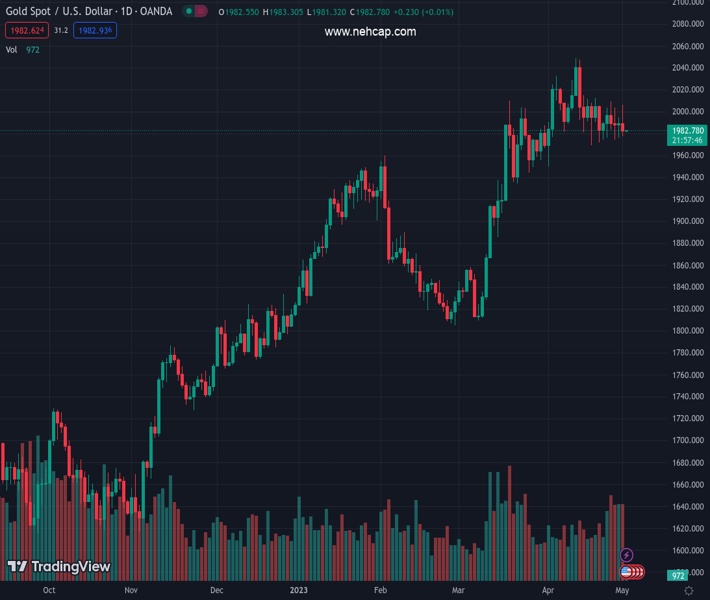
#XAUUSD @ 1,982.60 Gold price is defending its downside around $1,980.00, downside bias is deepening ahead of Fed policy. (Pivot Orderbook analysis)
…
This is a premium post.
[s2If !current_user_can(access_s2member_level4)]Please register for FREE REGISTER to read full post below containing analysis. In case of any error or you think you are not able to read the full post below, please email us at support#nehcap.com [lwa][/s2If] [s2If current_user_can(access_s2member_level1)]
- Gold price is defending its downside around $1,980.00, downside bias is deepening ahead of Fed policy.
- US labor market conditions are expected to lose further as Morgan Stanley has announced 3K more job cuts.
- Gold price is consolidating in a Symmetrical Triangle in which volatility contracts ahead of a critical event.
The pair currently trades last at 1982.60.
The previous day high was 1995.07 while the previous day low was 1976.28. The daily 38.2% Fib levels comes at 1987.89, expected to provide resistance. Similarly, the daily 61.8% fib level is at 1983.46, expected to provide resistance.
Gold price (XAU/USD) is continuously defending downside around the crucial support of $1,980.00 for the past few weeks. The precious metal is prone to downside as the appeal for the US Dollar Index (DXY) is improving ahead of the interest rate decision by the Federal Reserve (Fed).
A consecutive 25 basis point (bp) interest rate hike is expected from Fed chair Jerome Powell to continue to weigh pressure on United States inflation. One more 25bp rate hike from the Fed is widely expected, however, the event that is infusing anxiety among the market participants is the interest rate guidance.
Considering recent events of declining growth rate as US Gross Domestic Product (GDP) slowed to 1.1% on a quarterly basis due to lower inventories, ISM Manufacturing PMI landed below 50.0 straight for the sixth month and a downward revision to Retail Sales indicate that the Fed would sound neutral on guidance.
Apart from that, US labor market conditions are expected to lose further as Morgan Stanley has announced a planned lay-off of 3K more jobs as deals have slumped as reported by Bloomberg.
Meanwhile, S&P500 settled Monday’s session with some losses as investors are turning cautious ahead of the interest rate policy by the Fed. The USD Index is gathering strength for breaking above the immediate resistance of 102.20.
Gold price is consolidating in a Symmetrical Triangle chart pattern on a four-hour scale in which volatility contracts significantly ahead of a critical event. The upward-sloping trendline of the aforementioned pattern is plotted from April 19 low at $1,969.26 while the downward-sloping trendline is placed from April 17 high at $2,015.23.
The 20-period Exponential Moving Average (EMA) at $1,987.20 seems sticky to the Gold price, indicating a rangebound auction.
Also, the Relative Strength Index (RSI) (14) is hovering in the 40.00-60.00 range, which hints at a sheer consolidation.
Technical Levels: Supports and Resistances
XAUUSD currently trading at 1981.5 at the time of writing. Pair opened at 1989.92 and is trading with a change of -0.42 % .
| Overview | Overview.1 | |
|---|---|---|
| 0 | Today last price | 1981.50 |
| 1 | Today Daily Change | -8.42 |
| 2 | Today Daily Change % | -0.42 |
| 3 | Today daily open | 1989.92 |
The pair is trading below its 20 Daily moving average @ 1999.67, above its 50 Daily moving average @ 1933.99 , above its 100 Daily moving average @ 1897.52 and above its 200 Daily moving average @ 1807.42
| Trends | Trends.1 | |
|---|---|---|
| 0 | Daily SMA20 | 1999.67 |
| 1 | Daily SMA50 | 1933.99 |
| 2 | Daily SMA100 | 1897.52 |
| 3 | Daily SMA200 | 1807.42 |
The previous day high was 1995.07 while the previous day low was 1976.28. The daily 38.2% Fib levels comes at 1987.89, expected to provide resistance. Similarly, the daily 61.8% fib level is at 1983.46, expected to provide resistance.
Note the levels of interest below:
- Pivot support is noted at 1979.11, 1968.3, 1960.32
- Pivot resistance is noted at 1997.9, 2005.88, 2016.69
| Levels | Levels.1 |
|---|---|
| Previous Daily High | 1995.07 |
| Previous Daily Low | 1976.28 |
| Previous Weekly High | 2009.41 |
| Previous Weekly Low | 1974.13 |
| Previous Monthly High | 2048.75 |
| Previous Monthly Low | 1949.83 |
| Daily Fibonacci 38.2% | 1987.89 |
| Daily Fibonacci 61.8% | 1983.46 |
| Daily Pivot Point S1 | 1979.11 |
| Daily Pivot Point S2 | 1968.30 |
| Daily Pivot Point S3 | 1960.32 |
| Daily Pivot Point R1 | 1997.90 |
| Daily Pivot Point R2 | 2005.88 |
| Daily Pivot Point R3 | 2016.69 |
[/s2If]
Nehcap Expert Advisor
The NEHCAP MT4 EA is high quality professional trading system geared to generate returns without using GRID or martingales. Each trade has strict risk per trade parameter. The pairs under management include EURUSD, GBPUSD, AUDCAD, AUDNZD,GBPAUD, EURAUD, EURCAD, CHFJPY and many more.
The system is trading live: LIVE ACCOUNT TRACKING
You can run it free. Apply for a free trial and track our account. Buy the system or use profit share mechanism to generate returns on your MT4.
Join Our Telegram Group


