WTI is under pressure as US Dollar firms are on good news for the banking sector. (Pivot Orderbook analysis)
…
This is a premium post.
[s2If !current_user_can(access_s2member_level4)]Please register for FREE REGISTER to read full post below containing analysis. In case of any error or you think you are not able to read the full post below, please email us at support#nehcap.com [lwa][/s2If] [s2If current_user_can(access_s2member_level1)]
- WTI is under pressure as US Dollar firms are on good news for the banking sector.
- China falls below contraction territory, weighing on oil.
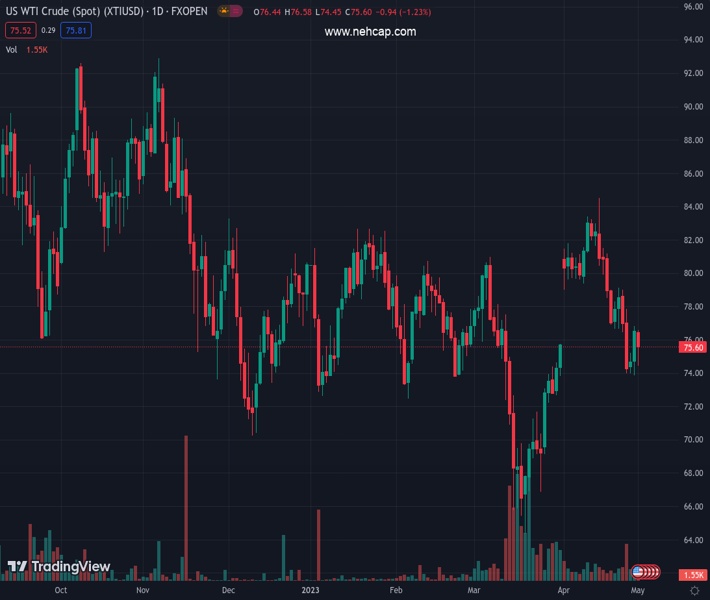
The pair currently trades last at 75.68.
The previous day high was 76.85 while the previous day low was 73.88. The daily 38.2% Fib levels comes at 75.71, expected to provide resistance. Similarly, the daily 61.8% fib level is at 75.01, expected to provide support.
West Texas Intermediate crude oil prices Monday lower and have traveled between a low of $74.58 and $76.65 so far.
The US Dollar index on Monday reached a to a 1-1/2 week high and has weighed on the price of commodities, including Oil while US data and Chinese data have been the focus to start the week. At the same time, the US Dollar has found a boost as investors digested news of JPMorgan Chase’s takeover of First Republic Bank, ahead of Wednesday’s policy decision by the US Federal Reserve.
JPMorgan Chase has bought failed First Republic Bank’s deposits and a “substantial amount of their assets and certain liabilities,” JPMorgan Chase said in a press release Monday.
“Our government invited us and others to step up, and we did,” JPMorgan Chase CEO Jamie Dimon said in a statement. “This acquisition modestly benefits our company overall, it is accretive to shareholders, it helps further advance our wealth strategy, and it is complementary to our existing franchise.”
In the Chinese economic news, the concerns have hit oil prices as China’s April manufacturing and non-manufacturing activity slowed more than expected. The China Apr manufacturing PMI dropped -2.7 to a 4-month low of 49.2, weaker than expectations of 51.4. Also, the Apr non-manufacturing PMI fell -1.8 to 56.4, weaker than expectations of 57.0.
On the other side of the Pacific, the April ISM manufacturing index rose +0.8 to 46.1, stronger than expectations of 46.8. Also, Mar construction spending rose +0.3% MoM, stronger than expectations of +0.1% MoM and the largest increase in 4 months.
Specific to the industry, Reuters reported that last Wednesday’s EIA report showed that (1) U.S. crude oil inventories as of April 21 were -0.5% below the seasonal 5-year average, (2) gasoline inventories were -7.2% below the seasonal 5-year average, and (3) distillate inventories were -12.4% below the 5-year seasonal average. U.S. crude oil production in the week ended April 21 fell -0.8% w/w to 12.2 million bpd, only 0.9 million bpd (-6.9%) below the Feb-2020 record-high of 13.1 million bpd.
Meanwhile, the Baker Hughes reported last Friday that active US oil rigs in the week ended April 28 were unchanged at 591 rigs, moderately below the 2-1/2 year high of 627 rigs posted on December 2. US active oil rigs have more than tripled from the 17-year low of 172 rigs seen in Aug 2020, signaling an increase in US crude oil production capacity.
Speculators have started to unwind their long exposure in WTI crude oil, while also adding short positions, analysts at TD Securities explained.
´´Despite the latest inventory statistics which continue to show robust product demand and dwindling inventories, crude markets were rocked by the reemergence of recessionary fears and bank liquidity concerns.´´
´´Prices have since collapsed, seeing the entirety of the OPEC+ driven rally reversed. But, as risk appetite stabilizes and fundamentals continue to look tighter in the second half of the year, CTAs could again turn buyers and offer support to crude oil markets in the coming weeks,´´ the analysts concluded.
Technical Levels: Supports and Resistances
XTIUSD currently trading at 75.68 at the time of writing. Pair opened at 76.57 and is trading with a change of -1.16 % .
| Overview | Overview.1 | |
|---|---|---|
| 0 | Today last price | 75.68 |
| 1 | Today Daily Change | -0.89 |
| 2 | Today Daily Change % | -1.16 |
| 3 | Today daily open | 76.57 |
The pair remains strongly bearish on the daily time frame. It trades below the 20 SMA @ 79.23, 50 SMA 76.12, 100 SMA @ 77.0 and 200 SMA @ 81.61.
| Trends | Trends.1 | |
|---|---|---|
| 0 | Daily SMA20 | 79.23 |
| 1 | Daily SMA50 | 76.12 |
| 2 | Daily SMA100 | 77.00 |
| 3 | Daily SMA200 | 81.61 |
The previous day high was 76.85 while the previous day low was 73.88. The daily 38.2% Fib levels comes at 75.71, expected to provide resistance. Similarly, the daily 61.8% fib level is at 75.01, expected to provide support.
Note the levels of interest below:
- Pivot support is noted at 74.68, 72.79, 71.71
- Pivot resistance is noted at 77.66, 78.74, 80.63
| Levels | Levels.1 |
|---|---|
| Previous Daily High | 76.85 |
| Previous Daily Low | 73.88 |
| Previous Weekly High | 79.14 |
| Previous Weekly Low | 73.88 |
| Previous Monthly High | 83.40 |
| Previous Monthly Low | 73.88 |
| Daily Fibonacci 38.2% | 75.71 |
| Daily Fibonacci 61.8% | 75.01 |
| Daily Pivot Point S1 | 74.68 |
| Daily Pivot Point S2 | 72.79 |
| Daily Pivot Point S3 | 71.71 |
| Daily Pivot Point R1 | 77.66 |
| Daily Pivot Point R2 | 78.74 |
| Daily Pivot Point R3 | 80.63 |
[/s2If]
Nehcap Expert Advisor
The NEHCAP MT4 EA is high quality professional trading system geared to generate returns without using GRID or martingales. Each trade has strict risk per trade parameter. The pairs under management include EURUSD, GBPUSD, AUDCAD, AUDNZD,GBPAUD, EURAUD, EURCAD, CHFJPY and many more.
The system is trading live: LIVE ACCOUNT TRACKING
You can run it free. Apply for a free trial and track our account. Buy the system or use profit share mechanism to generate returns on your MT4.
Join Our Telegram Group


