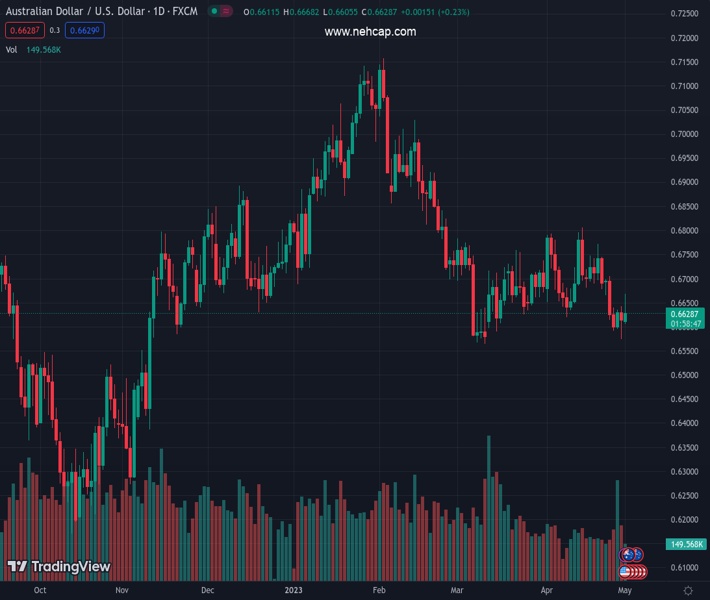
#AUDUSD @ 0.66295 holds to its gains and remains above 0.6600 on overall risk sentiment. (Pivot Orderbook analysis)
…
This is a premium post.
[s2If !current_user_can(access_s2member_level4)]Please register for FREE REGISTER to read full post below containing analysis. In case of any error or you think you are not able to read the full post below, please email us at support#nehcap.com [lwa][/s2If] [s2If current_user_can(access_s2member_level1)]
- AUD/USD holds to its gains and remains above 0.6600 on overall risk sentiment.
- US manufacturing activity improved, though higher prices justify the need for further Fed tightening.
- Weaker than expected, China’s data capped the AUD/USD’s rally towards 0.6700.
The pair currently trades last at 0.66295.
The previous day high was 0.6642 while the previous day low was 0.6574. The daily 38.2% Fib levels comes at 0.66, expected to provide support. Similarly, the daily 61.8% fib level is at 0.6616, expected to provide support.
The Australian Dollar (AUD) clings to some gains after hitting a daily high of 0.6668, though renewed US Dollar (USD) strength spurred a dip toward current exchange rates. That was sparked by the latest week’s inflation data, alongside an improvement in manufacturing activity. At the time of writing, the AUD/USD is trading at 0.6635.
Wall Street portrays an upbeat market sentiment after JP Morgan acquired the failed lender First Republic Bank. Market participants were bracing for another hike by the US Federal Reserve (Fed) and weighed on the AUD/USD’s pair.
A report by the Institute for Supply Management (ISM) revealed the Manufacturing PMI for April at 47.1, improving from March’s 46.3 but missed the chance to enter the expansionary territory. One of the subcomponents of the ISM’s poll, the Prices Index, surprisingly jumped to 53.2 from 49, indicating that inflation is picking up amongst US factories.
In the meantime, the US Dollar Index (DXY), a gauge for the buck’s value vs. a basket of six currencies, advances 0.43%, up at 102.112, a headwind for the AUD/USD pair. US Treasury bond yields climbed and underpinned the buck, as shown by the DXY
Aside from this, the Fed’s odds for a 25 bps rate hike stand at 88.9%, as shown by the CME Fed Watch Tool.
Aside from this, over the weekend, data from China increased concerns about its growth, with the National Bureau of Statistics (NBS) revealing that the Manufacturing PMI in April slowed down from 51.9 to 49.2. The Non- Manufacturing PMI rose to 56.4, down from 58.2 in March, while the composite Index stood at 54.4, from 57.
“A lack of market demand and the high-base effect from the quick manufacturing recovery in the first quarter” was among the factors that led to the contraction in April, said senior NBS statistician Zhao Qinghe.
Even though China’s outlook looks gloomy, the AUD/USD held to its earlier gains. Data from Australia witnessed the Judo Bank Manufacturing PMI rising to 48, below the prior’s month 49.1, while the TD-MI inflation gauge rose by 0.2%, below the latest month’s 0.3%.
In further data, Australia’s Labor government will reveal a vast improvement in the country’s budget bottom line next week, which has been helped by tax windfalls and job gains. Nevertheless, Treasurer Jim Chalmers has warned that fiscal challenges persist, and the government aims to be responsible with spending to avoid inflation, particularly since the Reserve Bank of Australia is aggressively lifting interest rates.
Technical Levels: Supports and Resistances
AUDUSD currently trading at 0.6629 at the time of writing. Pair opened at 0.6616 and is trading with a change of 0.2 % .
| Overview | Overview.1 | |
|---|---|---|
| 0 | Today last price | 0.6629 |
| 1 | Today Daily Change | 0.0013 |
| 2 | Today Daily Change % | 0.2000 |
| 3 | Today daily open | 0.6616 |
The pair remains strongly bearish on the daily time frame. It trades below the 20 SMA @ 0.669, 50 SMA 0.6698, 100 SMA @ 0.6793 and 200 SMA @ 0.6737.
| Trends | Trends.1 | |
|---|---|---|
| 0 | Daily SMA20 | 0.6690 |
| 1 | Daily SMA50 | 0.6698 |
| 2 | Daily SMA100 | 0.6793 |
| 3 | Daily SMA200 | 0.6737 |
The previous day high was 0.6642 while the previous day low was 0.6574. The daily 38.2% Fib levels comes at 0.66, expected to provide support. Similarly, the daily 61.8% fib level is at 0.6616, expected to provide support.
Note the levels of interest below:
- Pivot support is noted at 0.6579, 0.6542, 0.6511
- Pivot resistance is noted at 0.6648, 0.6679, 0.6716
| Levels | Levels.1 |
|---|---|
| Previous Daily High | 0.6642 |
| Previous Daily Low | 0.6574 |
| Previous Weekly High | 0.6706 |
| Previous Weekly Low | 0.6574 |
| Previous Monthly High | 0.6806 |
| Previous Monthly Low | 0.6574 |
| Daily Fibonacci 38.2% | 0.6600 |
| Daily Fibonacci 61.8% | 0.6616 |
| Daily Pivot Point S1 | 0.6579 |
| Daily Pivot Point S2 | 0.6542 |
| Daily Pivot Point S3 | 0.6511 |
| Daily Pivot Point R1 | 0.6648 |
| Daily Pivot Point R2 | 0.6679 |
| Daily Pivot Point R3 | 0.6716 |
[/s2If]
Nehcap Expert Advisor
The NEHCAP MT4 EA is high quality professional trading system geared to generate returns without using GRID or martingales. Each trade has strict risk per trade parameter. The pairs under management include EURUSD, GBPUSD, AUDCAD, AUDNZD,GBPAUD, EURAUD, EURCAD, CHFJPY and many more.
The system is trading live: LIVE ACCOUNT TRACKING
You can run it free. Apply for a free trial and track our account. Buy the system or use profit share mechanism to generate returns on your MT4.
Join Our Telegram Group


