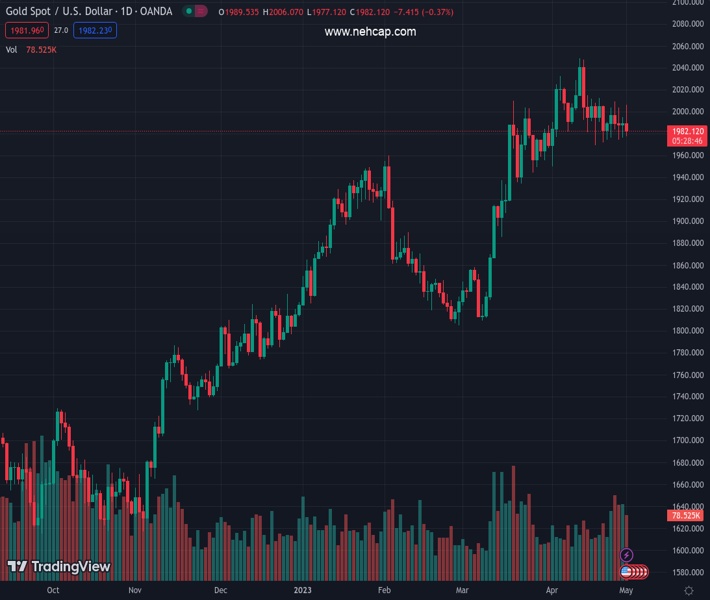
#XAUUSD @ 1,982.77 Gold price dips below $2000, extending its fall beneath the 20-day EMA. (Pivot Orderbook analysis)
…
This is a premium post.
[s2If !current_user_can(access_s2member_level4)]Please register for FREE REGISTER to read full post below containing analysis. In case of any error or you think you are not able to read the full post below, please email us at support#nehcap.com [lwa][/s2If] [s2If current_user_can(access_s2member_level1)]
- Gold price dips below $2000, extending its fall beneath the 20-day EMA.
- The ISM showed that manufacturing activity in the US improved but flashed that prices jumped compared to last month’s data.
- XAU/USD Price Analysis: To continue to fall as the RSI indicator approaches the 50-midline
The pair currently trades last at 1982.77.
The previous day high was 1995.07 while the previous day low was 1976.28. The daily 38.2% Fib levels comes at 1987.89, expected to provide resistance. Similarly, the daily 61.8% fib level is at 1983.46, expected to provide resistance.
Gold price slides below the $2000 barrier on a report by the Institute for Supply Management (ISM), showing that manufacturing activity is improving. However, a jump in the prices subcomponent justifies the need for higher rates in the United States (US). The XAU/USD is trading at $1982.70.
Wall Street opened with gains after JP Morgan Chase, of the largest banks in the US, acquired the troubled First Republic Bank. That improved the market mood, though the ISM’s data triggered a leg down in XAU/USD’s price.
The ISM Manufacturing PMI for April remained in contractionary territory for the fifth month, after expanding for 30 consecutive months, at 47.1, higher than March’s 46.3. Delving into the data, the Orders and Production subcomponents improved but lacked the strength to enter the expansionary territory. The Prices Index jumped 4 points to 53.2, sparking speculations that the Federal Reserve (Fed) will tighten monetary conditions next Wednesday.
The XAU/USD reacted downwards, down 0.11% in the early New York session. US Treasury bond yields increased, with the 10-year benchmark note rate yielding 3.513%, gaining eight bps, a headwind for the yellow metal.
The US Dollar Index (DXY), which measures the performance of six currencies vs. the greenback, is climbing 0.33%, up at 102.009, courtesy of elevated US Treasury bond yields.
Despite the backdrop, the latest report for growth in the US), recessionary fears linger around the US economy. The Advanced Gross Domestic Product (GDP) for ¡2 2023 at 1.1% showed that the economy is slowing down. But the Core PCE, the Fed’s preferred gauge for inflation, stood at around 4.6% for the second straight month,
Therefore, the CME FedWatch Tool flashes an 88.9% chance the Fed will raise rates by 25 bps to 5.00% 5.25%. Notably, the swaps market shows a 40% chance for the first rate cut in November’s meeting.
Following today’s data, the US economic agenda will feature the JOLTs Job Openings report and Factory Orders on Tuesday. On Wednesday, the Federal Reserve monetary policy decision will be highlighted.
After hitting a daily high of $2005.99, the XAU/USD retreated sharply, exchanging hands below the 20-day Exponential Moving Average (EMA), which lies at $1988.60. Oscillators like the Relative Strength Index (RSI) indicators continued to show that sellers are gathering momentum, about to cross beneath the 50-midline. If that happens, XAU/USD could extend its losses toward the 50-day EMA at $1954.44, which, if cleared, the Gold price can extend its losses toward the 100-day EMA at $1906.42.
Technical Levels: Supports and Resistances
XAUUSD currently trading at 1984.31 at the time of writing. Pair opened at 1989.92 and is trading with a change of -0.28 % .
| Overview | Overview.1 | |
|---|---|---|
| 0 | Today last price | 1984.31 |
| 1 | Today Daily Change | -5.61 |
| 2 | Today Daily Change % | -0.28 |
| 3 | Today daily open | 1989.92 |
The pair is trading below its 20 Daily moving average @ 1999.67, above its 50 Daily moving average @ 1933.99 , above its 100 Daily moving average @ 1897.52 and above its 200 Daily moving average @ 1807.42
| Trends | Trends.1 | |
|---|---|---|
| 0 | Daily SMA20 | 1999.67 |
| 1 | Daily SMA50 | 1933.99 |
| 2 | Daily SMA100 | 1897.52 |
| 3 | Daily SMA200 | 1807.42 |
The previous day high was 1995.07 while the previous day low was 1976.28. The daily 38.2% Fib levels comes at 1987.89, expected to provide resistance. Similarly, the daily 61.8% fib level is at 1983.46, expected to provide resistance.
Note the levels of interest below:
- Pivot support is noted at 1979.11, 1968.3, 1960.32
- Pivot resistance is noted at 1997.9, 2005.88, 2016.69
| Levels | Levels.1 |
|---|---|
| Previous Daily High | 1995.07 |
| Previous Daily Low | 1976.28 |
| Previous Weekly High | 2009.41 |
| Previous Weekly Low | 1974.13 |
| Previous Monthly High | 2048.75 |
| Previous Monthly Low | 1949.83 |
| Daily Fibonacci 38.2% | 1987.89 |
| Daily Fibonacci 61.8% | 1983.46 |
| Daily Pivot Point S1 | 1979.11 |
| Daily Pivot Point S2 | 1968.30 |
| Daily Pivot Point S3 | 1960.32 |
| Daily Pivot Point R1 | 1997.90 |
| Daily Pivot Point R2 | 2005.88 |
| Daily Pivot Point R3 | 2016.69 |
[/s2If]
Nehcap Expert Advisor
The NEHCAP MT4 EA is high quality professional trading system geared to generate returns without using GRID or martingales. Each trade has strict risk per trade parameter. The pairs under management include EURUSD, GBPUSD, AUDCAD, AUDNZD,GBPAUD, EURAUD, EURCAD, CHFJPY and many more.
The system is trading live: LIVE ACCOUNT TRACKING
You can run it free. Apply for a free trial and track our account. Buy the system or use profit share mechanism to generate returns on your MT4.
Join Our Telegram Group


