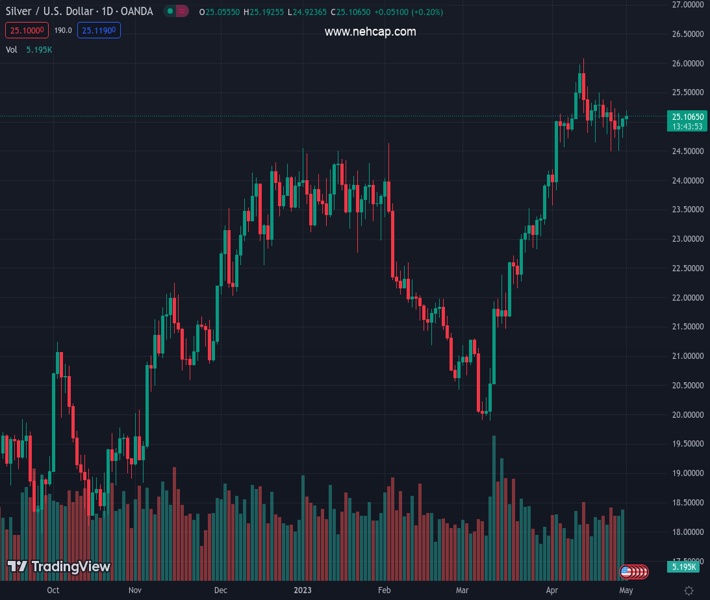
#XAGUSD @ 25.103 Silver struggles to gain any meaningful traction and oscillates in a narrow band on Monday. (Pivot Orderbook analysis)
…
This is a premium post.
[s2If !current_user_can(access_s2member_level4)]Please register for FREE REGISTER to read full post below containing analysis. In case of any error or you think you are not able to read the full post below, please email us at support#nehcap.com [lwa][/s2If] [s2If current_user_can(access_s2member_level1)]
- Silver struggles to gain any meaningful traction and oscillates in a narrow band on Monday.
- The technical setup favours bullish traders and supports prospects for some intraday gains.
- A convincing break below the 23.6% Fibo. is needed to negate the near-term positive bias.
The pair currently trades last at 25.103.
The previous day high was 25.07 while the previous day low was 24.73. The daily 38.2% Fib levels comes at 24.94, expected to provide support. Similarly, the daily 61.8% fib level is at 24.86, expected to provide support.
Silver reverses an intraday dip to sub-$25.00 levels and touches a three-day daily high during the early European session on Monday, though lacks follow-through. The white metal has been struggling to make it through the 100-period Simple Moving Average (SMA), warranting some caution for bullish traders and before positioning for an extension of the recent bounce from the $24.50-$24.40 horizontal support.
Looking at the broader picture, the XAG/USD is holding comfortably above the 23.6% Fibonacci retracement level of the March-April rally. Moreover, technical indicators on the daily chart maintain their bullish bias and have been gaining positive traction on hourly charts. This, in turn, supports prospects for some intraday appreciating move back towards the $25.50 supply zone. Some follow-through buying will negate any negative bias and pave the way for additional gains.
The XAG/USD might then make a fresh attempt to conquer the $26.00 round-figure mark and retest a one-year high touched on April 14. The positive momentum could get extended further towards the next relevant hurdle near the $26.25-$26.30 region en route to the 2022 swing high, just ahead of the $27.00 round-figure mark.
On the flip side, the $24.50-$24.40 region might continue to act as immediate strong support, which if broken decisively might prompt some technical selling. The subsequent downfall has the potential to drag the XAG/USD below the $24.00 mark, towards testing the 38.2% Fibo. level, around the $23.70 area. The corrective decline could get extended further towards the $23.35-$23.30 horizontal support before the metal drops to the $23.00 confluence, comprising the 50% Fibo. level and the 50-day SMA.
Technical Levels: Supports and Resistances
XAGUSD currently trading at 25.09 at the time of writing. Pair opened at 25.06 and is trading with a change of 0.12 % .
| Overview | Overview.1 | |
|---|---|---|
| 0 | Today last price | 25.09 |
| 1 | Today Daily Change | 0.03 |
| 2 | Today Daily Change % | 0.12 |
| 3 | Today daily open | 25.06 |
The pair remains strongly bullish on the daily timeframe. It trades above its 20 SMA @ 25.03, 50 SMA 23.07, 100 SMA @ 23.22 and 200 SMA @ 21.57.
| Trends | Trends.1 | |
|---|---|---|
| 0 | Daily SMA20 | 25.03 |
| 1 | Daily SMA50 | 23.07 |
| 2 | Daily SMA100 | 23.22 |
| 3 | Daily SMA200 | 21.57 |
The previous day high was 25.07 while the previous day low was 24.73. The daily 38.2% Fib levels comes at 24.94, expected to provide support. Similarly, the daily 61.8% fib level is at 24.86, expected to provide support.
Note the levels of interest below:
- Pivot support is noted at 24.84, 24.61, 24.49
- Pivot resistance is noted at 25.18, 25.3, 25.52
| Levels | Levels.1 |
|---|---|
| Previous Daily High | 25.07 |
| Previous Daily Low | 24.73 |
| Previous Weekly High | 25.36 |
| Previous Weekly Low | 24.49 |
| Previous Monthly High | 26.09 |
| Previous Monthly Low | 23.57 |
| Daily Fibonacci 38.2% | 24.94 |
| Daily Fibonacci 61.8% | 24.86 |
| Daily Pivot Point S1 | 24.84 |
| Daily Pivot Point S2 | 24.61 |
| Daily Pivot Point S3 | 24.49 |
| Daily Pivot Point R1 | 25.18 |
| Daily Pivot Point R2 | 25.30 |
| Daily Pivot Point R3 | 25.52 |
[/s2If]
Nehcap Expert Advisor
The NEHCAP MT4 EA is high quality professional trading system geared to generate returns without using GRID or martingales. Each trade has strict risk per trade parameter. The pairs under management include EURUSD, GBPUSD, AUDCAD, AUDNZD,GBPAUD, EURAUD, EURCAD, CHFJPY and many more.
The system is trading live: LIVE ACCOUNT TRACKING
You can run it free. Apply for a free trial and track our account. Buy the system or use profit share mechanism to generate returns on your MT4.
Join Our Telegram Group


