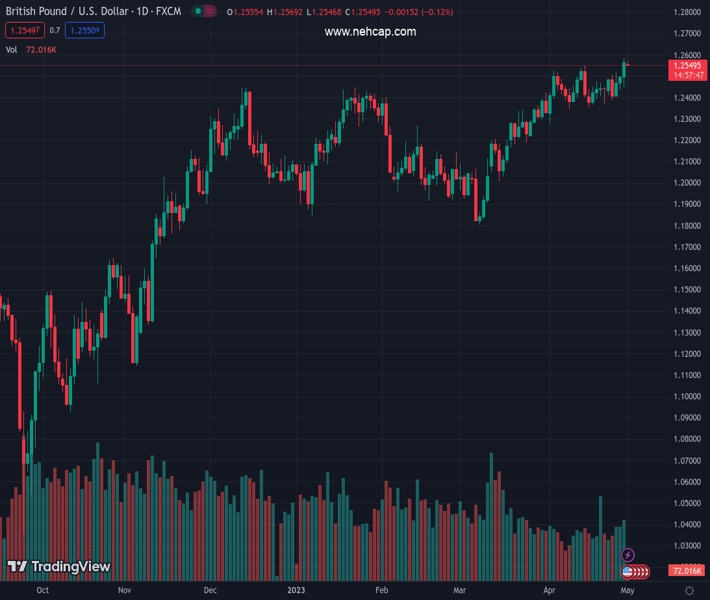
#GBPUSD @ 1.25513 is showing signs of exhaustion in the upside momentum after failing to extend the upside above 1.2583. (Pivot Orderbook analysis)
…
This is a premium post.
[s2If !current_user_can(access_s2member_level4)]Please register for FREE REGISTER to read full post below containing analysis. In case of any error or you think you are not able to read the full post below, please email us at support#nehcap.com [lwa][/s2If] [s2If current_user_can(access_s2member_level1)]
- GBP/USD is showing signs of exhaustion in the upside momentum after failing to extend the upside above 1.2583.
- The risk profile is favoring risk-sensitive assets amid solid quarterly performance from US tech-savvy stocks.
- GBP/USD has delivered a breakout of the Rising Channel chart pattern and is testing it with a minor correction to near 1.2546.
The pair currently trades last at 1.25513.
The previous day high was 1.2584 while the previous day low was 1.2446. The daily 38.2% Fib levels comes at 1.2531, expected to provide support. Similarly, the daily 61.8% fib level is at 1.2499, expected to provide support.
The GBP/USD pair is showing signs of exhaustion in the upside momentum after failing to extend the upside above 1.2583. The Cable has turned sideways around 1.2560 as investors are preparing for monetary policy by the Federal Reserve (Fed), which is scheduled for Wednesday.
The risk profile is favoring risk-sensitive assets as S&P500 futures are having minimal gains after a bullish Friday. Investors were gung-ho for United States equities after a solid quarterly performance from tech-savvy stocks.
The US Dollar Index (DXY) is eyeing a further stretch in recovery above 101.80 as the Fed is expected to raise interest rates further to tame sticky core inflation. US Consumer spending is resilient amid higher outlays for services.
GBP/USD has delivered a breakout of the Rising Channel chart pattern on a two-hour scale. An upside break of the Rising Channel chart pattern indicates sheer strength in the Pound Sterling. The immediate support is plotted from April 14 high at 1.2546.
Advancing 20-period Exponential Moving Average (EMA) at 1.2530 indicates more upside ahead.
Also, the Relative Strength Index (RSI) (14) has shifted into the bullish range of 60.00-80.00, hinting that the upside momentum is active for now.
A successful test of breakout near April 14 high at 1.2546 will drive the asset towards a fresh 10-month high at 1.2597, which is 08 June 2022 high. A breach of the latter will expose the asset to May 27 high at 1.2667.
On the flip side, a slippage below April 10 low at 1.2345 will expose the asset to March 30 low at 1.2294 followed by March 27 low at 1.2219.
Technical Levels: Supports and Resistances
GBPUSD currently trading at 1.255 at the time of writing. Pair opened at 1.2569 and is trading with a change of -0.15 % .
| Overview | Overview.1 | |
|---|---|---|
| 0 | Today last price | 1.2550 |
| 1 | Today Daily Change | -0.0019 |
| 2 | Today Daily Change % | -0.1500 |
| 3 | Today daily open | 1.2569 |
The pair remains strongly bullish on the daily timeframe. It trades above its 20 SMA @ 1.2451, 50 SMA 1.2251, 100 SMA @ 1.2212 and 200 SMA @ 1.194.
| Trends | Trends.1 | |
|---|---|---|
| 0 | Daily SMA20 | 1.2451 |
| 1 | Daily SMA50 | 1.2251 |
| 2 | Daily SMA100 | 1.2212 |
| 3 | Daily SMA200 | 1.1940 |
The previous day high was 1.2584 while the previous day low was 1.2446. The daily 38.2% Fib levels comes at 1.2531, expected to provide support. Similarly, the daily 61.8% fib level is at 1.2499, expected to provide support.
Note the levels of interest below:
- Pivot support is noted at 1.2482, 1.2396, 1.2345
- Pivot resistance is noted at 1.262, 1.267, 1.2757
| Levels | Levels.1 |
|---|---|
| Previous Daily High | 1.2584 |
| Previous Daily Low | 1.2446 |
| Previous Weekly High | 1.2584 |
| Previous Weekly Low | 1.2387 |
| Previous Monthly High | 1.2584 |
| Previous Monthly Low | 1.2275 |
| Daily Fibonacci 38.2% | 1.2531 |
| Daily Fibonacci 61.8% | 1.2499 |
| Daily Pivot Point S1 | 1.2482 |
| Daily Pivot Point S2 | 1.2396 |
| Daily Pivot Point S3 | 1.2345 |
| Daily Pivot Point R1 | 1.2620 |
| Daily Pivot Point R2 | 1.2670 |
| Daily Pivot Point R3 | 1.2757 |
[/s2If]
Nehcap Expert Advisor
The NEHCAP MT4 EA is high quality professional trading system geared to generate returns without using GRID or martingales. Each trade has strict risk per trade parameter. The pairs under management include EURUSD, GBPUSD, AUDCAD, AUDNZD,GBPAUD, EURAUD, EURCAD, CHFJPY and many more.
The system is trading live: LIVE ACCOUNT TRACKING
You can run it free. Apply for a free trial and track our account. Buy the system or use profit share mechanism to generate returns on your MT4.
Join Our Telegram Group


