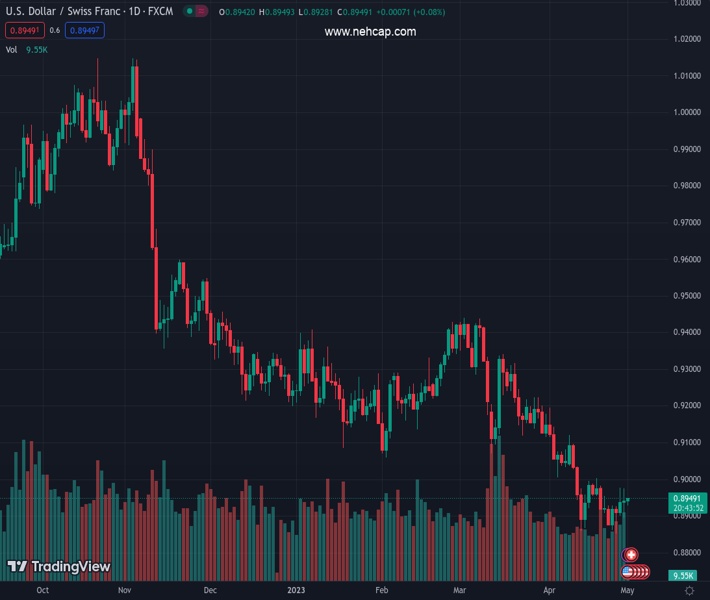
#USDCHF @ 0.89469 has extended its recovery being supported by the US Dollar ahead of Fed policy. (Pivot Orderbook analysis)
…
This is a premium post.
[s2If !current_user_can(access_s2member_level4)]Please register for FREE REGISTER to read full post below containing analysis. In case of any error or you think you are not able to read the full post below, please email us at support#nehcap.com [lwa][/s2If] [s2If current_user_can(access_s2member_level1)]
- USD/CHF has extended its recovery being supported by the US Dollar ahead of Fed policy.
- Swiss’s annual Real Retail Sales contracted sharply by 1.9% while the street was anticipating an expansion by 1.7%.
- USD/CHF is preparing for a bullish reversal as it is gathering strength after breaking the declining trendline plotted at 0.9439.
The pair currently trades last at 0.89469.
The previous day high was 0.8975 while the previous day low was 0.8896. The daily 38.2% Fib levels comes at 0.8926, expected to provide support. Similarly, the daily 61.8% fib level is at 0.8945, expected to provide support.
The USD/CHF pair is eyeing a recovery extension above the immediate resistance of 0.8946 in the early Tokyo session. The Swiss franc asset recovered swiftly from the round-level support of 0.8900 as investors are running for the US Dollar Index (DXY) as a safe-haven ahead of the interest rate decision by the Federal Reserve (Fed).
S&P500 futures are showing some losses in early Asia as investors are getting anxious ahead of United States ISM Manufacturing PMI (April) and Fed’s monetary policy, portraying a caution in an overall risk appetite theme. The US Dollar Index (DXY) is approaching the critical resistance of 101.80 amid an improvement in its safe-haven appeal.
The Swiss franc remained in action on Friday after the release of Real Retail Sales (March) data. Annual Real Retail Sales contracted sharply by 1.9% while the street was anticipating an expansion by 1.7%. This would be a relief for the Swiss National Bank (SNB), which is struggling to tame stubborn inflation.
Investors should be aware that the Swiss economy will remain closed on Monday on account of Labor Day.
USD/CHF is preparing for a bullish reversal as it is gathering strength after breaking the downward-sloping trendline plotted around March 08 high at 0.9439 on a two-hour scale. The Swiss Franc asset is confidently shifting above 20-period Exponential Moving Average (EMA) at 0.8936, indicating a bullish shift in the short-term trend.
The major has shown a recovery after forming a Triple Bottom chart pattern which indicates that the downside bias is over as the entire selling has dried.
The Relative Strength Index (RSI) (14) has shifted into the 40.00-60.00 range. A move into the bullish range of 60.00-80.00 will strengthen the US Dollar bulls further.
Should the asset decisively breaks above the psychological resistance at 0.9000, US Dollar bulls will drive the asset towards April 07 low and high at 0.9034 and 0.9082 respectively.
Alternatively, a downside move below April 17 low at 0.8922 will drag the asset toward April 13 low at 0.8860. A slippage below the latter will expose the asset to the round-level support at 0.8800.
Technical Levels: Supports and Resistances
USDCHF currently trading at 0.8948 at the time of writing. Pair opened at 0.8944 and is trading with a change of 0.04 % .
| Overview | Overview.1 | |
|---|---|---|
| 0 | Today last price | 0.8948 |
| 1 | Today Daily Change | 0.0004 |
| 2 | Today Daily Change % | 0.0400 |
| 3 | Today daily open | 0.8944 |
The pair remains strongly bearish on the daily time frame. It trades below the 20 SMA @ 0.8982, 50 SMA 0.9157, 100 SMA @ 0.9204 and 200 SMA @ 0.9448.
| Trends | Trends.1 | |
|---|---|---|
| 0 | Daily SMA20 | 0.8982 |
| 1 | Daily SMA50 | 0.9157 |
| 2 | Daily SMA100 | 0.9204 |
| 3 | Daily SMA200 | 0.9448 |
The previous day high was 0.8975 while the previous day low was 0.8896. The daily 38.2% Fib levels comes at 0.8926, expected to provide support. Similarly, the daily 61.8% fib level is at 0.8945, expected to provide support.
Note the levels of interest below:
- Pivot support is noted at 0.8902, 0.8859, 0.8822
- Pivot resistance is noted at 0.8981, 0.9018, 0.906
| Levels | Levels.1 |
|---|---|
| Previous Daily High | 0.8975 |
| Previous Daily Low | 0.8896 |
| Previous Weekly High | 0.8976 |
| Previous Weekly Low | 0.8852 |
| Previous Monthly High | 0.9440 |
| Previous Monthly Low | 0.9072 |
| Daily Fibonacci 38.2% | 0.8926 |
| Daily Fibonacci 61.8% | 0.8945 |
| Daily Pivot Point S1 | 0.8902 |
| Daily Pivot Point S2 | 0.8859 |
| Daily Pivot Point S3 | 0.8822 |
| Daily Pivot Point R1 | 0.8981 |
| Daily Pivot Point R2 | 0.9018 |
| Daily Pivot Point R3 | 0.9060 |
[/s2If]
Nehcap Expert Advisor
The NEHCAP MT4 EA is high quality professional trading system geared to generate returns without using GRID or martingales. Each trade has strict risk per trade parameter. The pairs under management include EURUSD, GBPUSD, AUDCAD, AUDNZD,GBPAUD, EURAUD, EURCAD, CHFJPY and many more.
The system is trading live: LIVE ACCOUNT TRACKING
You can run it free. Apply for a free trial and track our account. Buy the system or use profit share mechanism to generate returns on your MT4.
Join Our Telegram Group


