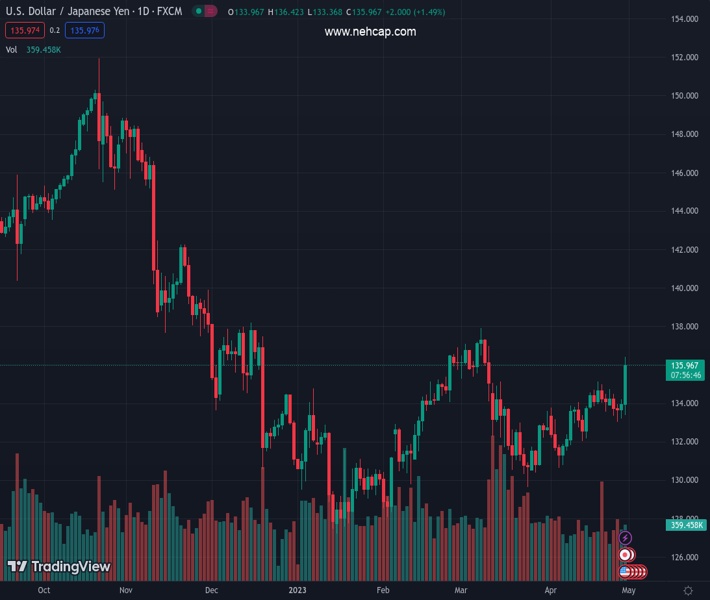
#USDJPY @ 136.056 rallies over 300 pips intraday and spikes to its highest level since March 10. (Pivot Orderbook analysis)
…
This is a premium post.
[s2If !current_user_can(access_s2member_level4)]Please register for FREE REGISTER to read full post below containing analysis. In case of any error or you think you are not able to read the full post below, please email us at support#nehcap.com [lwa][/s2If] [s2If current_user_can(access_s2member_level1)]
- USD/JPY rallies over 300 pips intraday and spikes to its highest level since March 10.
- The BoJ’s dovish stance weighs heavily on the JPY and prompts aggressive buying.
- Bets for another 25 bps lift-off in May underpin the USD and contribute to the rise.
- The US Core PCE Price Index fails to provide any meaningful impetus to the major.
The pair currently trades last at 136.056.
The previous day high was 134.2 while the previous day low was 133.21. The daily 38.2% Fib levels comes at 133.82, expected to provide support. Similarly, the daily 61.8% fib level is at 133.59, expected to provide support.
The USD/JPY pair builds on its strong intraday rally and climbs to its highest level since March 10, around the 136.40 region during the early North American session. Spot prices, however, retreat a few pips following the release of the US macro data and trade around the 136.00 mark, still up over 1.5% for the day.
The Japanese Yen (JPY) turns out to be the worst-performing G10 currency on Friday in reaction to the Bank of Japan’s (BoJ) decision to leave its ultra-loose monetary policy settings unchanged. The Japanese central bank also made no tweaks to its yield curve control (YCC) by a unanimous vote, while the BoJ Governor sounded dovish during the post-meeting press conference. This, along with resurgent US Dollar (USD) demand, provides a goodish lift to the USD/JPY pair and further contributes to the intraday rally of over 300 pips.
In fact, the USD Index (DXY), which tracks the Greenback against a basket of currencies, touches a two-and-half-week high amid firming expectations for another 25 bps lift-off at the next FOMC meeting in May. The USD, however, eases a bit after the US Bureau of Economic Analysis reported that the US Personal Consumption Expenditures (PCE) Price Index declined more than expected, to 4.2% on a yearly basis in March from 5.1% previously. The Core PCE Price Index (the Fed’s preferred inflation gauge), meanwhile, edged lower to 4.6% from 4.7%.
This, along with a sharp intraday declining in the US Treasury bond yields, keeps a lid on any further gains for the Greenback. Apart from this, the risk-off impulse – as depicted by a generally weaker tone around the equity markets – lends some support to the safe-haven JPY and acts as a headwind for the USD/JPY pair amid slightly overbought oscillators on hourly charts. Nevertheless, spot prices remain on track to register strong gains for the third successive week, also marking the fifth week of a positive move in the previous six.
Technical Levels: Supports and Resistances
USDJPY currently trading at 136.13 at the time of writing. Pair opened at 133.95 and is trading with a change of 1.63 % .
| Overview | Overview.1 | |
|---|---|---|
| 0 | Today last price | 136.13 |
| 1 | Today Daily Change | 2.18 |
| 2 | Today Daily Change % | 1.63 |
| 3 | Today daily open | 133.95 |
The pair is trading above its 20 Daily moving average @ 133.32, above its 50 Daily moving average @ 133.79 , above its 100 Daily moving average @ 132.89 and below its 200 Daily moving average @ 136.99
| Trends | Trends.1 | |
|---|---|---|
| 0 | Daily SMA20 | 133.32 |
| 1 | Daily SMA50 | 133.79 |
| 2 | Daily SMA100 | 132.89 |
| 3 | Daily SMA200 | 136.99 |
The previous day high was 134.2 while the previous day low was 133.21. The daily 38.2% Fib levels comes at 133.82, expected to provide support. Similarly, the daily 61.8% fib level is at 133.59, expected to provide support.
Note the levels of interest below:
- Pivot support is noted at 133.37, 132.8, 132.39
- Pivot resistance is noted at 134.36, 134.77, 135.34
| Levels | Levels.1 |
|---|---|
| Previous Daily High | 134.20 |
| Previous Daily Low | 133.21 |
| Previous Weekly High | 135.14 |
| Previous Weekly Low | 133.55 |
| Previous Monthly High | 137.91 |
| Previous Monthly Low | 129.64 |
| Daily Fibonacci 38.2% | 133.82 |
| Daily Fibonacci 61.8% | 133.59 |
| Daily Pivot Point S1 | 133.37 |
| Daily Pivot Point S2 | 132.80 |
| Daily Pivot Point S3 | 132.39 |
| Daily Pivot Point R1 | 134.36 |
| Daily Pivot Point R2 | 134.77 |
| Daily Pivot Point R3 | 135.34 |
[/s2If]
Nehcap Expert Advisor
The NEHCAP MT4 EA is high quality professional trading system geared to generate returns without using GRID or martingales. Each trade has strict risk per trade parameter. The pairs under management include EURUSD, GBPUSD, AUDCAD, AUDNZD,GBPAUD, EURAUD, EURCAD, CHFJPY and many more.
The system is trading live: LIVE ACCOUNT TRACKING
You can run it free. Apply for a free trial and track our account. Buy the system or use profit share mechanism to generate returns on your MT4.
Join Our Telegram Group


