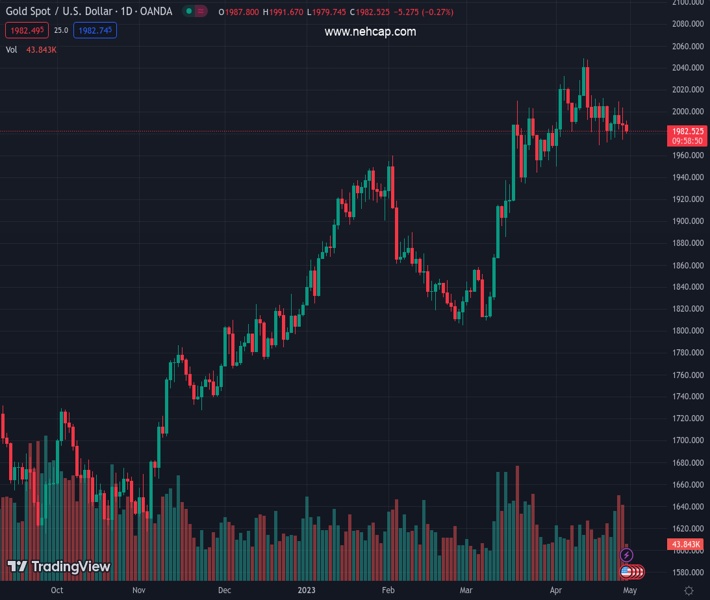
#XAUUSD @ 1,983.29 Gold price remains on the defensive for the third straight day amid a stronger US Dollar. (Pivot Orderbook analysis)
…
This is a premium post.
[s2If !current_user_can(access_s2member_level4)]Please register for FREE REGISTER to read full post below containing analysis. In case of any error or you think you are not able to read the full post below, please email us at support#nehcap.com [lwa][/s2If] [s2If current_user_can(access_s2member_level1)]
- Gold price remains on the defensive for the third straight day amid a stronger US Dollar.
- Reviving safe-haven demand lends some support to the XAU/USD and helps limit losses.
- Traders also seem reluctant and move to the sidelines ahead of the US PCE Price Index.
The pair currently trades last at 1983.29.
The previous day high was 2003.7 while the previous day low was 1974.13. The daily 38.2% Fib levels comes at 1985.43, expected to provide resistance. Similarly, the daily 61.8% fib level is at 1992.4, expected to provide resistance.
Gold price edges lower for the third successive day on Friday, albeit lacks follow-through selling and remains confined in a familiar trading range held over the past two weeks or so. The XAU/USD is currently placed just above the $1,980 level and is influenced by a combination of diverging forces.
The US Dollar (USD) regains strong positive traction and touches a fresh weekly high amid firming expectations for another 25 basis points (bps) lift-off at the next Federal Open Market Committee (FOMC) policy meeting in May. In fact, the USD Index, which tracks the Greenback against a basket of currencies, touches a fresh weekly high and exerts some downward pressure on the US Dollar-denominated Gold price. The prospects for further policy tightening by the Federal Reserve (Fed) were reaffirmed by the latest macro data released on Thursday from the United States (US), which indicated persistent price pressures and that the labor market remains healthy.
The US Bureau of Economic Analysis reported that growth in the world’s largest economy slowed from 2.6% annualized pace to 1.1% during the first quarter of 2023, missing estimates for a reading of 2.0%. The disappointment, however, was offset by the GDP Price Index, which edged higher to 4% from 3.9%. Moreover, the Personal Consumption Expenditures (PCE) Prices rose from 3.7% to 4.2% during the January-March period, while the Core PCE climbed 4.9%, higher than the 4.7% estimated. Adding to this, data published by the US Department of Labor (DOL) showed that Initial Jobless claims fell to 230K in the week ended April 22 – the lowest in three weeks.
That said, a combination of factors lends some support to the Gold price and helps limit the downside, at least for the time being. Worries about economic headwinds stemming from rising borrowing costs temper investors’ appetite for riskier assets, which is evident from a generally softer tone around the equity markets. The anti-risk flow triggers a sharp decline in the US Treasury bond yields and turns out to be a key factor acting as a tailwind for the safe-haven Gold price. Traders also seem reluctant to place aggressive directional bets and wait on the sidelines ahead of Friday’s release of the US Core PCE Price Index – the Fed’s preferred inflation gauge.
Given that the markets have been pricing in an imminent pause in the Fed’s rate-hiking cycle after May, a stronger PCE Price Index report might prompt aggressive short-covering around the USD. Gold price, however, could benefit from its status as a hedge against rising inflation. Conversely, any disappointment will be enough to weigh heavily on the buck and provide a fresh boost to the XAU/USD. This, in turn, suggests that the path of least resistance for the commodity is to the downside and any subsequent slide could get bought into.
From a technical perspective, any subsequent slide is likely to find some support near last week’s swing low, just below the $1,970 level. Some follow-through selling will be seen as a fresh trigger for bearish traders and make the Gold price vulnerable to test the next relevant support near the $1,956-$1,955 area. The XAU/USD could eventually drop to the monthly low around the $1,950 region.
On the flip side, the intraday positive move now seems to confront some resistance near the $2,000 psychological mark ahead of the $2,010 supply zone and the $2,020 horizontal barrier. A sustained strength beyond the latter will be seen as a fresh trigger for bulls and lift the Gold price move towards the $2,040 area. Bulls might eventually aim to challenge the YTD peak, around the $2,047-$2,049 region touched earlier this month.
Technical Levels: Supports and Resistances
XAUUSD currently trading at 1983.5 at the time of writing. Pair opened at 1987.74 and is trading with a change of -0.21 % .
| Overview | Overview.1 | |
|---|---|---|
| 0 | Today last price | 1983.50 |
| 1 | Today Daily Change | -4.24 |
| 2 | Today Daily Change % | -0.21 |
| 3 | Today daily open | 1987.74 |
The pair is trading below its 20 Daily moving average @ 1999.19, above its 50 Daily moving average @ 1930.93 , above its 100 Daily moving average @ 1895.5 and above its 200 Daily moving average @ 1806.06
| Trends | Trends.1 | |
|---|---|---|
| 0 | Daily SMA20 | 1999.19 |
| 1 | Daily SMA50 | 1930.93 |
| 2 | Daily SMA100 | 1895.50 |
| 3 | Daily SMA200 | 1806.06 |
The previous day high was 2003.7 while the previous day low was 1974.13. The daily 38.2% Fib levels comes at 1985.43, expected to provide resistance. Similarly, the daily 61.8% fib level is at 1992.4, expected to provide resistance.
Note the levels of interest below:
- Pivot support is noted at 1973.35, 1958.95, 1943.78
- Pivot resistance is noted at 2002.92, 2018.09, 2032.49
| Levels | Levels.1 |
|---|---|
| Previous Daily High | 2003.70 |
| Previous Daily Low | 1974.13 |
| Previous Weekly High | 2015.13 |
| Previous Weekly Low | 1969.26 |
| Previous Monthly High | 2009.88 |
| Previous Monthly Low | 1809.46 |
| Daily Fibonacci 38.2% | 1985.43 |
| Daily Fibonacci 61.8% | 1992.40 |
| Daily Pivot Point S1 | 1973.35 |
| Daily Pivot Point S2 | 1958.95 |
| Daily Pivot Point S3 | 1943.78 |
| Daily Pivot Point R1 | 2002.92 |
| Daily Pivot Point R2 | 2018.09 |
| Daily Pivot Point R3 | 2032.49 |
[/s2If]
Nehcap Expert Advisor
The NEHCAP MT4 EA is high quality professional trading system geared to generate returns without using GRID or martingales. Each trade has strict risk per trade parameter. The pairs under management include EURUSD, GBPUSD, AUDCAD, AUDNZD,GBPAUD, EURAUD, EURCAD, CHFJPY and many more.
The system is trading live: LIVE ACCOUNT TRACKING
You can run it free. Apply for a free trial and track our account. Buy the system or use profit share mechanism to generate returns on your MT4.
Join Our Telegram Group
")


